
Page 227 - PVT Property Correlations
P. 227
Low Gas Oil Ratio Oils Chapter | 8 197
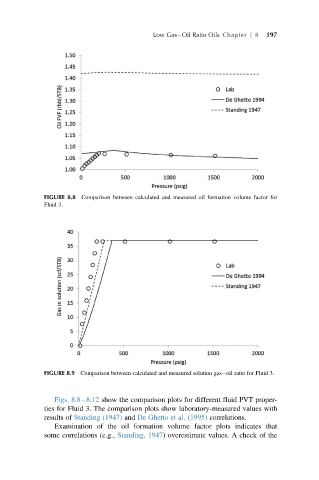
FIGURE 8.8 Comparison between calculated and measured oil formation volume factor for
Fluid 3.
FIGURE 8.9 Comparison between calculated and measured solution gas oil ratio for Fluid 3.
Figs. 8.8 8.12 show the comparison plots for different fluid PVT proper-
ties for Fluid 3. The comparison plots show laboratory-measured values with
results of Standing (1947) and De Ghetto et al. (1995) correlations.
Examination of the oil formation volume factor plots indicates that
some correlations (e.g., Standing, 1947) overestimate values. A check of the