
Page 280 - PVT Property Correlations
P. 280
246 PVT Property Correlations
Shateri, M., Ghorbani, S., Hemmati-Sarapardeh, A., Mohammadi, A.H., 2015. Application of
Wilcoxon generalized radial basis function network for prediction of natural gas compress-
ibility factor. J. Taiwan Inst. Chem. Eng. 50, 131 141.
FURTHER READING
Esfahani, S., Baselizadeh, S., Hemmati-Sarapardeh, A., 2015. On determination of natural gas
density: least square support vector machine modeling approach. J. Nat. Gas Sci. Eng. 22,
348 358.
Gholami, R., et al., 2014. Applications of artificial intelligence methods in prediction of perme-
ability in hydrocarbon reservoirs. J. Pet. Sci. Eng. 122, 643 656.
Hemmati-Sarapardeh, A., Aminshahidy, B., Pajouhandeh, A., Yousefi, S.H., Hosseini-
Kaldozakh, S.A., 2016. A soft computing approach for the determination of crude oil viscos-
ity: light and intermediate crude oil systems. J. Taiwan Inst. Chem. Eng. 59, 1 10.
Mohagheghian, E., Zafarian-Rigaki, H., Motamedi-Ghahfarrokhi, Y., Hemmati-Sarapardeh, A.,
2015. Using an artificial neural network to predict carbon dioxide compressibility factor at
high pressure and temperature. Korean J. Chem. Eng. 32 (10), 2087 2096.
Osman, E.-S.A. and Al-Marhoun, M.A., 2005. Artificial neural networks models for predicting
PVT properties of oil field brines. In: SPE-93765-MS Presented at the SPE Middle East Oil
and Gas Show and Conference, 12 15 March, Bahrain. https://doi.org/10.2118/93765-MS.
PROBLEMS
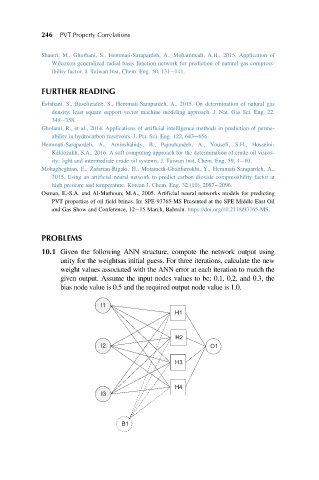
10.1 Given the following ANN structure, compute the network output using
unity for the weightsas initial guess. For three iterations, calculate the new
weight values associated with the ANN error at each iteration to match the
given output. Assume the input nodes values to be: 0.1, 0.2, and 0.3, the
bias node value is 0.5 and the required output node value is 1.0.
I1
H1
H2
I2 O1
H3
H4
I3
B1