
Page 278 - Packed bed columns for absorption, desorption, rectification and direct heat transfer
P. 278
268
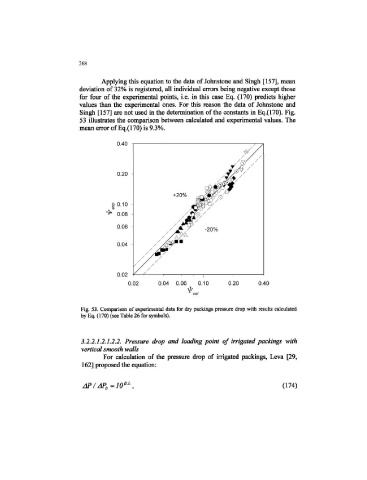
Applying this equation to the data of Johnstone and Singh [157], mean
deviation of 32% is registered, all individual errors being negative except those
for four of the experimental points, i.e. in this case Eq. (170) predicts higher
values than the experimental ones. For this reason the data of Johnstone and
Singh [157] are not used in the determination of the constants in Eq.(170). Fig.
53 illustrates the comparison between calculated and experimental values. The
mean error of Eq.(170) is 9.3%.
040
Y/
/
0.20 -
f
'• • ' <
+20%
£0.10
0.08
/A
0.06 /jT? -20%
//&
0.04
002
0.02 0.04 0.06 0.10 0.20 0.40
Fig. 53. Comparison of experimental data for dry packings pressure drop with results calculated
by Eq. (170) {see Table 26 for symbols).
3.2.2.1.2.1.2.2. Pressure drop and loading point of irrigated packings with
vertical smooth walls
For calculation of the pressure drop of irrigated packings, Leva [29,
162] proposed the equation:
fil
AP/AP 0=10 , (174)