
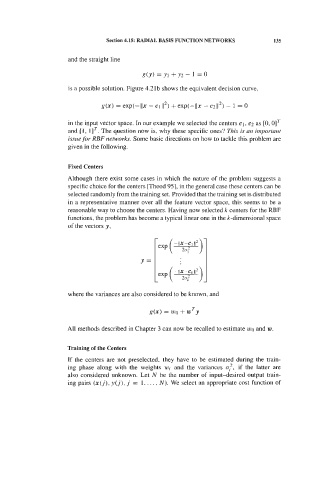
Page 152 -
P. 152
4.7 Statistical Classifiers in Data Mining   139


                                - The ill-posed nature of the data mining problems, usually  with  many available
                                  solutions but no clear means of judging  their relative quality This is due to: the
                                  curse of  dimensionality already mentioned in section 2.6, which is definitely a
                                  relevant phenomenon in many data mining applications; the incorrect inferences
                                  from correlation  to causality; the difficulty in  measuring the usefulness of  the
                                  inferred relations.
                                  The most important statistical classifier approach in data mining is the decision
                                tree  approach. As  a matter of  fact, tree classification can  be  achieved  in  a very
                                efficient way, e.g., by using the previously described CART approach, and can also
                                provide  important  semantic information,  especially when  using  univariate  splits.
                                The contribution of individual features to the target classification, which  is a top
                                requirement in data mining applications, is then easily grasped.
                                   In order  to get a taste of  the application of tree classification to a typical data
                                 mining problem, and to discuss some of the issues that have just  been enumerated,
                                 we  will  consider  the  problem  of  assessing  foetal  heart  rate  (FHR)  variability
                                 indexes  in  the  diagnostic  of  a  pathological  foetal  state  responsible  for  a  "flat-
                                 sinusoidal" (FS) tracing. For this purpose, we will use the CTG dataset with 2126
                                 cases (see Appendix A). Four variability indexes are used (MLTV, MSTV, ALTV,
                                 ASTV),  which  measure the  average short-term  (beat to beat)  and  average long-
                                 term  (in  1  minute  sliding  window)  variability  of  the  heart  rate,  as  well  as  the
                                 percentage of time they are abnormal (i.e.,  below a certain threshold).
                                   Using the CART design approach available in Statistics, we obtain the decision
                                 tree of Figure 4.45, which uses only two variability indexes (percentage of time the
                                 short-term and long-term variabilities are abnormal).


                                  Figure 4.45.  Decision tree for the flat-sinusoidal class (FS) in 2126 FHR tracings.
                                  FS cases correspond to the dotted rectangles, non-FS to the solid ones.