
Page 244 -
P. 244
232 5 Neural Networks
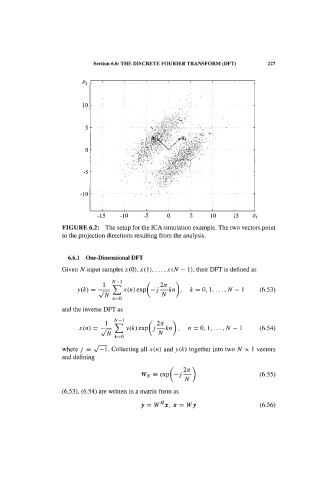
(A, B, C, D, AD, DE, LD, SHIFT, SUSP, FS)
w,={A, FS, SUSP) w2={B, C, D, AD, DE, LD, SHIFT)
A FS SUSP
Figure 5.57. First levels of a tree classifier for the CTG data, with merged classes
A, FS and SUSP.
Looking at Table 5.9 results, we see that in fact some improvement has been
made over the previous solution concerning the discrimination of those three
classes. In general, the hierarchical network approach can achieve better results if
the simplified discriminations at the top levels can be solved in a very efficient
way. Identification of clusters in the data, factor analysis and multidimensional
scaling may be used in order to judge if there are well-separated groups of classes,
appropriate for top-level discrimination.
Another motivation to use a modular approach occurs when searching for the
"best" neural net solution to a given problem. During the search process one often
derives alternative solutions that are discarded. These solutions may use the same
inputs with different initial weights, or use alternative input sets. Discarding
solutions may not be the most reasonable approach, namely if these solutions can
add complementary information to the problem at hand. Instead, we may profit
from the complementary characteristics of these nets, and achieve a better
performing solution by using an ensemble of neural networks. We can do this by
establishing a voting scheme based on the net outputs, as shown in Figure 5.58.
Table 5.9. MLPs classification matrices for the class discriminations shown in
Figure 5.57. True classifications along the columns; predicted classifications along
the rows.
(a) (b)
SUSP
SUSP
97.14% 85.51 % 99.49%
92.06% 81.04% 94.29%
PC - Probability of correct classification (training set estimate) at each level
P, - Total probability of correct classification (training set estimate for classes A, FS and
SUSP).