
Page 110 - Percolation Models for Transport in Porous Media With
P. 110
5.2 VISCOSITIES AND INTERFACIAL TENSION 103
K(S)
ICID •••-
...
...
...
.
,.
... ..,l:-::&~.':'l: ... ~.J?to.~':'i.
S. S. Slr,l
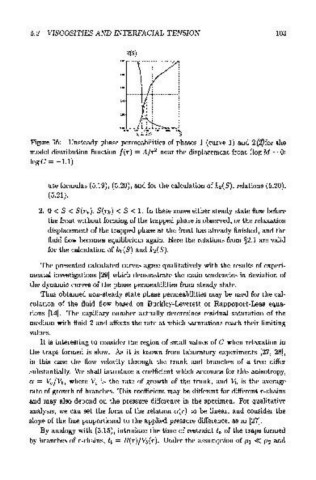
Figure 36: Unsteady phase permeabilities of phases 1 (curve 1) and 2 (2)for the
model distribution function f(r) = A/r 2 near the displacement front {logM = 0;
logC = -1.1)
use formulas {5.19), {5.20), and for the calculation of k2{S), relations {5.20),
{5.21).
2. 0 < S < S(r.), S(rk) < S < 1. In these zones either steady state flow before
the front without forming of the trapped phase is observed, or the relaxation
displacement of the trapped phase at the front has already finished, and the
fluid flow becomes equilibrium again. Here the relations from §2.1 are valid
for the calculation of k1{S) and k2{S).
The presented calculated curves agree qualitatively with the results of experi-
mental investigations (29] which demonstrate the main tendencies in deviation of
the dynamic curves of the phase permeabilities from steady state.
Thus obtained non-steady state phase permeabilities may be used for the cal-
culation of the fluid flow based on Buckley-Leverett or Rappoport-Leas equa-
tions (14]. The capillary number actually determines residual saturation of the
medium with fluid 2 and affects the rate at which saturations reach their limiting
values.
It is interesting to consider the region of small values of C when relaxation in
the traps formed is slow. As it is known from laboratory experiments (27, 28],
in this case the flow velocity through the trunk and branches of a tree differ
substantially. We shall introduce a coefficient which accounts for this anisotropy,
a = Vc/Vi., where Vc is the rate of growth of the trunk, and Vi. is the average
rate of growth of branches. This coefficient may be different for different r-chains
and may also depend on the pressure difference in the specimen. For qualitative
analysis, we can set the form of the relation a(r) to be linear, and consider the
slope of the line proportional to the applied pressure difference, as in [27].
By analogy with (5.15), introduce the time of restraint tb of the traps formed
by branches of r-chains, tb = R(r)/Vb(r). Under the assumption of 1£1 « 1£2 and