
Page 71 - Percolation Models for Transport in Porous Media With
P. 71
4.1 FLOW OF IMMISCIBLE FLUIDS 63
I
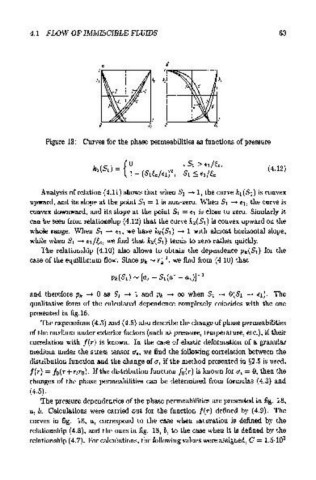
Figure 18: Curves for the phase permeabilities as functions of pressure
(4.12)
Analysis of relation (4.11) shows that when 51 -+ 1, the curve k1(SI) is convex
upward, and its slope at the point 51 = 1 is non-zero. When 51 -+ ft, the curve is
convex downward, and its slope at the point 5 1 = £1 is close to zero. Similarly it
can be seen from relationship (4.12) that the curve k2(St) is convex upward on the
whole range. When 51 -+ ft, we have k2(SI) -+ 1 with almost horizontal slope,
while when 5 1 -+ £t/~c, we find that k2(St) tends to zero rather quickly.
The relationship (4.10) also allows to obtain the dependence Pk(Sl) for the
case of the equilibrium flow. Since Pk "'r; , we find from (4.10) that
1
and therefore Pk ,-+ 0 as St -+ 1 and Pk -+ oo when S1 -+ O(S1 -+ £1). The
qualitative form of the calculated dependence completely coincides with the one
presented in fig.16.
The expressions ( 4.3) and ( 4.5) also describe the change of phase permeabilities
of the medium under exterior factors (such as pressure, temperature, etc.), if their
correlation with /(r) is known. In the case of elastic deformation of a granular
medium under the stress tensor u1, we find the following correlation between the
distribution function and the change of u, if the method presented in §2.5 is used,
f(r) = f0(r+£lr0). If the distribution function /o(r) is known for u, = 0, then the
changes of the phase permeabilities can be determined from formulas ( 4.3) and
(4.5).
The pressure dependencies of the phase permeabilities are presented in fig. 18,
a, b. Calculations were carried out for the function f(r) defined by (4.9). The
curves in fig. 18, a, correspond to the case when saturation is defined by the
relationship ( 4.8), and the ones in fig. 18, b, to the case when it is defined by the
relationship ( 4. 7). For calculations, the following values were assigned, C = 1.5·10 3