Page 181 - Petroleum and Gas Field Processing
P. 181

For T ¼ 1058F:  d m ¼ 200  o ¼ 200ð20Þ 0:25  ¼ 423 mm
                 For T ¼ 858F:  d m ¼ 200  o ¼ 200ð45Þ 0:25  ¼ 518 mm
            Ignoring the effect of temperature on specific gravity, use Eq. (13) to
            determine the settling constraint for each treating temperature:

                  For T ¼ 125 F
                                              7000   10
                                   Q o   o
                         DL ¼ 436        ¼ 436        2  ¼ 1204 in: ft   ðE1Þ
                                  ð 
Þd m     0:2   356
                  For T ¼ 105 F

                                              7000   20
                                   Q o   o
                         DL ¼ 436        ¼ 436          ¼ 1706 in: ft    ðE2Þ
                                  ð 
Þd m     0:2   423 2

                  For T ¼ 85 F
                                              7000   45
                                   Q o   o
                         DL ¼ 436        ¼ 436        2  ¼ 2559 in: ft   ðE3Þ
                                  ð 
Þd m     0:2   518
            Use Eq. (14) to determine the relationship for retention time constraints:
                       Q o t  7000   20
                  2                              2
                 D L ¼     ¼          ¼ 133,333 in: ft                   ðE4Þ
                       1:05    1:05
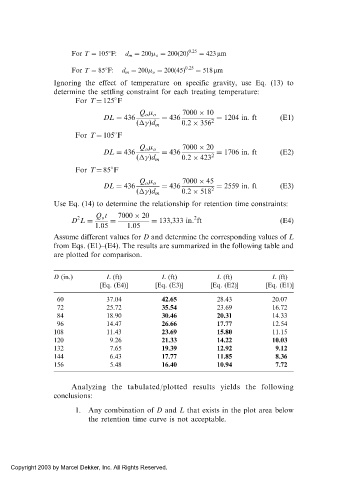
            Assume different values for D and determine the corresponding values of L
            from Eqs. (E1)–(E4). The results are summarized in the following table and
            are plotted for comparison.


            D (in.)       L (ft)         L (ft)         L (ft)        L (ft)
                        [Eq. (E4)]     [Eq. (E3)]     [Eq. (E2)]     [Eq. (E1)]

             60           37.04          42.65          28.43          20.07
             72           25.72          35.54          23.69          16.72
             84           18.90          30.46          20.31          14.33
             96           14.47          26.66          17.77          12.54
            108           11.43          23.69          15.80          11.15
            120            9.26          21.33          14.22          10.03
            132            7.65          19.39          12.92          9.12
            144            6.43          17.77          11.85          8.36
            156            5.48          16.40          10.94          7.72


                 Analyzing the tabulated/plotted results yields the following
            conclusions:
                  1. Any combination of D and L that exists in the plot area below
                     the retention time curve is not acceptable.


 Copyright 2003 by Marcel Dekker, Inc. All Rights Reserved.
   176   177   178   179   180   181   182   183   184   185   186