
Page 76 - Petroleum and Gas Field Processing
P. 76
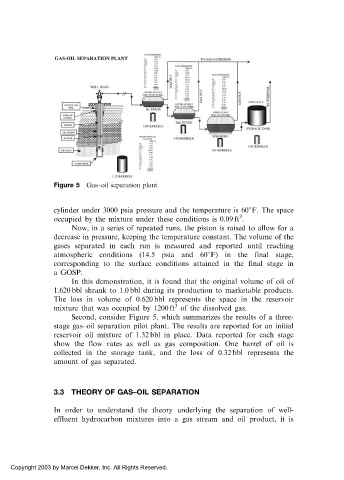
Figure 5  Gas–oil separation plant.


            cylinder under 3000 psia pressure and the temperature is 60 F. The space
                                                              3
            occupied by the mixture under these conditions is 0.09 ft .
                 Now, in a series of repeated runs, the piston is raised to allow for a
            decrease in pressure, keeping the temperature constant. The volume of the
            gases separated in each run is measured and reported until reaching

            atmospheric conditions (14.5 psia and 60 F) in the final stage,
            corresponding to the surface conditions attained in the final stage in
            a GOSP.
                 In this demonstration, it is found that the original volume of oil of
            1.620 bbl shrank to 1.0 bbl during its production to marketable products.
            The loss in volume of 0.620 bbl represents the space in the reservoir
                                            3
            mixture that was occupied by 1200 ft of the dissolved gas.
                 Second, consider Figure 5, which summarizes the results of a three-
            stage gas–oil separation pilot plant. The results are reported for an initial
            reservoir oil mixture of 1.32 bbl in place. Data reported for each stage
            show the flow rates as well as gas composition. One barrel of oil is
            collected in the storage tank, and the loss of 0.32 bbl represents the
            amount of gas separated.


            3.3  THEORY OF GAS–OIL SEPARATION

            In order to understand the theory underlying the separation of well-
            effluent hydrocarbon mixtures into a gas stream and oil product, it is


 Copyright 2003 by Marcel Dekker, Inc. All Rights Reserved.