
Page 16 - Petrology of Sedimentary Rocks
P. 16
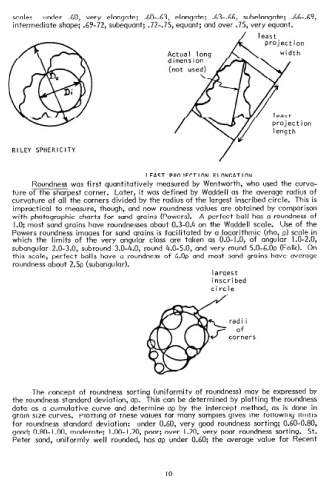
scale:   under   .60,   very   elongate;   .60-.63,   elongate;   .63-.66,   subelongate;   .66-.69,
     intermediate   shape;   .69-72,   subequant;   .72-.75,   equant;   and  over   .75,  very   equant.
                                                                                least
                                                                                  project   i on
                                                    Actual   lona                     widt  h


                                                                                    least
                                                                                    projec   tion
                                                                                    length


     RILEY   SPHERICITY
                                                                    /
                                              LEAST  PROJECTION   ELONGATION
           Roundness   was  first   quantitatively   measured   by  Wentworth,   who   used  the  curva-
     ture   of  the  sharpest   corner.   Later,   it  was  defined   by  Waddell   as  the  average   radius   of
     curvature   of  all  the  corners   divided   by  the  radius   of  the  largest   inscribed   circle.   This  is
     impractical   to  measure,   though,   and  now   roundness   values   are  obtained   by  comparison
     with   photographic   charts   for   sand  grains   (Powers).   A  perfect   ball   has  a  roundness   of
     1.0;  most  sand  grains   have   roundnesses   about   0.3-0.4   on  the  Waddeli   scale.   Use  of  the
     Powers   roundness   images   for  sand  grains   is  facilitated   by  a  logarithmic   (rho,   p)  scale   in
     which   the   limits   of  the   very   angular   class   are   taken   as  0.0-1.0,   of  angular   I .O-2.0,
     subangular   2.0-3.0,   subround   3.0-4.0,   round   4.0-5.0,   and  very   round   5.0-6.0~   (Folk).   On
     this  scale,   perfect   balls   have   a  roundness   of  6.0~  and  most   sand   grains   have   average
     roundness   about   2.5~  (subangular).
                                                                  largest
                                                                  inscribed
                                                                 circle


           The   concept   of  roundness   sorting   (uniformity   of  roundness)   may  be  expressed   by
     the  roundness   standard   deviation,   op.   This  can  be  determined   by  plotting   the  roundness
     data   as  a  cumulative   curve   and  determine   op  by  the  intercept   method,   as  is  done   in
     grain   size  curves.   Plotting   of  these   values   for  many   samples   gives   the  following   limits
     for   roundness   standard   deviation:   under   0.60,   very   good   roundness   sorting;   0.60-0.80,
     good;   0.80-  1.00,  moderate;   1.00-I  .20,  poor;   over   I .20,  very   poor   roundness   sorting.   St.
     Peter   sand,   uniformly   well   rounded,   has  up  under   0.60;   the   average   value   for   Recent


                                                    IO