
Page 162 - Petrophysics 2E
P. 162
PERMEABILITY-POROSITY RELATIONSHIPS 135
porosity, pore size distribution, bound and moveable fluid saturation,
and permeability on a foot-by-foot basis. Mathematical models, which
include pore-size distribution, predict permeability more accurately than
those that include effective porosity, since permeability is controlled by
the pore throat size.
A small relaxation time from an NMR tool corresponds to small pores
and a large relaxation time reflects the large pores. The distribution of the
time constant T2 in clastic rocks tends to be approximately log-normal.
A good single representation of the T2 is therefore obtained from the
geometric or logarithmic mean value. Schlumberger-Doll Research (SDR)
developed the following model for permeability 1361 :
k = 4T2ML($2
4
(3.67)
where:
k = permeability, mD
=
T~ML log mean of relaxation time, T2, milliseconds
($ = NMR porosity, fraction.
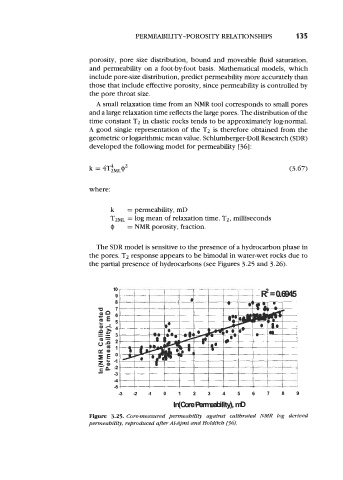
The SDR model is sensitive to the presence of a hydrocarbon phase in
the pores. T2 response appears to be bimodal in water-wet rocks due to
the partial presence of hydrocarbons (see Figures 3.25 and 3.26).
I I I I I I I I I
I I I I I I I I I I I I
4
d
-3 1 - 1 0 1 2 3 4 5 6 7 8 9
InpmRemeabiIii nD
Figure 3.25. Core-measured permeability against calibrated NMR log derived
permeability, reproduced after Al-Ajmi and Holditch [Mf.