
Page 260 - Petrophysics 2E
P. 260
FORMATION RESISTIVITY FACTOR 233
10 -
L -
r --
-
-
-
w
2 4-
0
U - Cor. Sample
0 Extrrated
11-1.91
2- 0 Non-oxtracted
n-2.71
1
0.1 0.2 0.4 0.6 0.8 1.0
Water Saturation. Sw
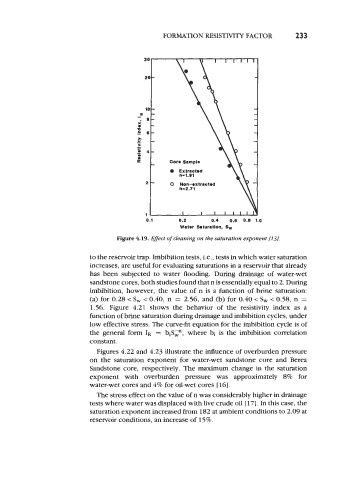
Figure 4.19. Effect of cleaning on the saturation exponent
to the reservoir trap. Imbibition tests, i.e., tests in which water saturation
increases, are useful for evaluating saturations in a reservoir that already
has been subjected to water flooding. During drainage of water-wet
sandstone cores, both studies found that n is essentially equal to 2. During
imbibition, however, the value of n is a function of brine saturation:
(a) for 0.28 < S, < 0.40, n = 2.56, and (b) for 0.40 < S, < 0.58, n =
1.56. Figure 4.21 shows the behavior of the resistivity index as a
function of brine saturation during drainage and imbibition cycles, under
low effective stress. The curve-fit equation for the imbibition cycle is of
the general form IR = biSGn, where bi is the imbibition correlation
constant.
Figures 4.22 and 4.23 illustrate the influence of overburden pressure
on the saturation exponent for water-wet sandstone core and Berea
Sandstone core, respectively. The maximum change in the saturation
exponent with overburden pressure was approximately 8% for
water-wet cores and 4% for oil-wet cores [ 161.
The stress effect on the value of n was considerably higher in drainage
tests where water was displaced with live crude oil [ 171. In this case, the
saturation exponent increased from 182 at ambient conditions to 2.09 at
reservoir conditions, an increase of 15%.