
Page 357 - Petrophysics
P. 357
MEASUREMENT OF CAPILLARY PRESSURE 325
W
a
a
v)
v)
w
a
n
).
3
e
8 t Pct
0 Slw Gor 1.0
WATER SATUR AT1 ON
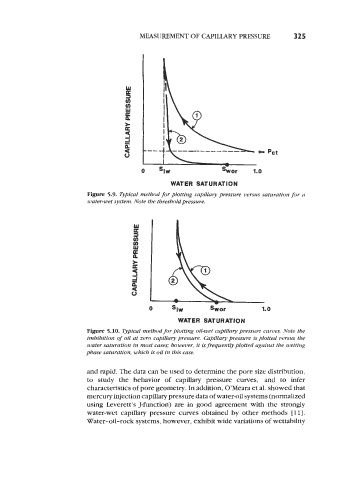
Figure 5.9. Typical method for plotting capillary pressure versus saturation for u
water-wet system. Note the threshold pressure.
0 SIW swor 1.0
WATER SAT UR AT I 0 N
Figure 5.10. Typical method for plotting oil-wet capillary pressure curves. Note the
imbibition of oil at zero capillary pressure. Capilla y pressure is plotted versus the
water saturation in most cases; however, it & frequently plotted against the wetting
phase saturation, which is oil in this case.
and rapid. The data can be used to determine the pore size distribution,
to study the behavior of capillary pressure curves, and to infer
characteristics of pore geometry. In addition, O’Meara et al. showed that
mercury injection capillary pressure data of water-oil systems (normalized
using Leverett’s J-function) are in good agreement with the strongly
water-wet capillary pressure curves obtained by other methods [ 111.
Water-oil-rock systems, however, exhibit wide variations of wettability