
Page 554 - Petrophysics
P. 554
PETROPHYSICAL PROPERTIES 52 1
iple 10
0.8 1 1 .o
0.0 0.2 0.4 0.6
Water saturation, fraction
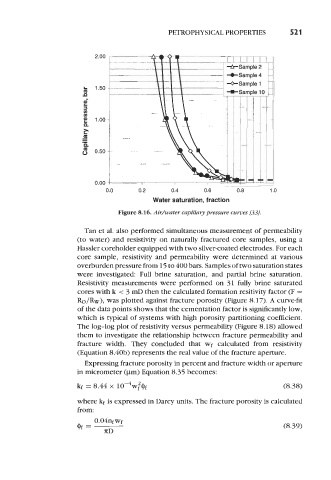
Figure 8.16. Air/water capillaty pressure cutzles [X?].
Tan et al. also performed simultaneous measurement of permeability
(to water) and resistivity on naturally fractured core samples, using a
Hassler coreholder equipped with two silvercoated electrodes. For each
core sample, resistivity and permeability were determined at various
overburden pressure from 15 to 400 bars. Samples of two saturation states
were investigated: Full brine saturation, and partial brine saturation.
Resistivity measurements were performed on 31 fully brine saturated
cores with k < 3 mD then the calculated formation resitivity factor (F =
&/Rw), was plotted against fracture porosity (Figure 8.17). A curve-fit
of the data points shows that the cementation factor is significantly low,
which is typical of systems with high porosity partitioning coefficient.
The log-log plot of resistivity versus permeability (Figure 8.18) allowed
them to investigate the relationship between fracture permeability and
fracture width. They concluded that wf calculated from resistivity
(Equation 8.40b) represents the real value of the fracture aperture.
Expressing fracture porosity in percent and fracture width or aperture
in micrometer (pm) Equation 8.35 becomes:
kf = 8.44 x lO-*w& (8.38)
where kf is expressed in Darcy units. The fracture porosity is calculated
from:
0.04nfwf
Of = (8.39)
7CD