Page 390 - Phase Space Optics Fundamentals and Applications
P. 390
Phase Space in Ultrafast Optics    371


               detector is a function of the center frequencies and the time of maxi-
               mum transmission   of the time gate
                                    7
                                             A             A

                    D({  C1 ,   C2 ,  }) =  dt N (t −  )  d  ˜ S (  −   C1 )

                                                                ;
                                                                 2

                                       A
                                     + ˜ S (  −   C2 ) ˜ E( ) exp(−i t)      (11.78)

                 The detected signal takes on a particularly useful form when certain
               assumptions regarding the filters are valid. The first assumption is that
               thepassbandofthespectralfiltersismuchnarrowerthanthespectrum
               of the input pulses, so that the spectral filter transfer functions become
                                   A
                                  ˜ S (  −   C ) →  (  −   C )     (11.79)
                 The second assumption is that the duration over which the time
               gate is open is much shorter than the temporal period of the beat note
               to be measured, so that the time-gate response function becomes
                                     A
                                    N (t −  ) →  (t −  )           (11.80)
                 The integration time of the square-law detector must be long
               enough that an average over a sufficiently large number of pulses
               is obtained. Changing the frequency variables to the center- and
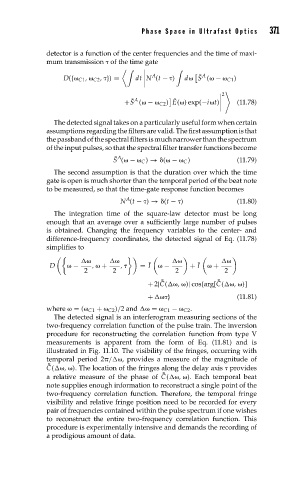
               difference-frequency coordinates, the detected signal of Eq. (11.78)
               simplifies to


                D      −    ,   +   ,    = ˜ I    −    + ˜ I    +
                          2       2                2            2
                                               ˜
                                                              ˜
                                           + 2| ˜ C(  ,  )| cos{arg[ ˜ C(  ,  )]
                                           +    }                  (11.81)
               where   = (  C1 +   C2 )/2 and    =   C1 −   C2 .
                 The detected signal is an interferogram measuring sections of the
               two-frequency correlation function of the pulse train. The inversion
               procedure for reconstructing the correlation function from type V
               measurements is apparent from the form of Eq. (11.81) and is
               illustrated in Fig. 11.10. The visibility of the fringes, occurring with
               temporal period 2 /  , provides a measure of the magnitude of
                ˜ ˜ C(  ,  ). The location of the fringes along the delay axis   provides
                                               ˜
               a relative measure of the phase of ˜ C(  ,  ). Each temporal beat
               note supplies enough information to reconstruct a single point of the
               two-frequency correlation function. Therefore, the temporal fringe
               visibility and relative fringe position need to be recorded for every
               pair of frequencies contained within the pulse spectrum if one wishes
               to reconstruct the entire two-frequency correlation function. This
               procedure is experimentally intensive and demands the recording of
               a prodigious amount of data.

