
Page 45 - Photonics Essentials an introduction with experiments
P. 45
Photodiodes
Photodiodes 39
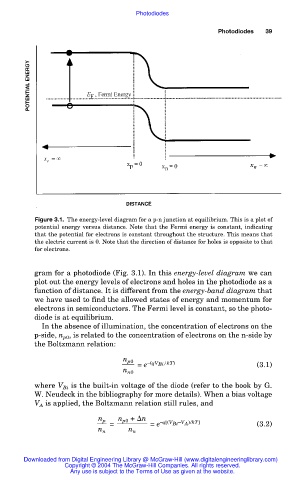
Figure 3.1. The energy-level diagram for a p-n junction at equilibrium. This is a plot of
potential energy versus distance. Note that the Fermi energy is constant, indicating
that the potential for electrons is constant throughout the structure. This means that
the electric current is 0. Note that the direction of distance for holes is opposite to that
for electrons.
gram for a photodiode (Fig. 3.1). In this energy-level diagram we can
plot out the energy levels of electrons and holes in the photodiode as a
function of distance. It is different from the energy-band diagram that
we have used to find the allowed states of energy and momentum for
electrons in semiconductors. The Fermi level is constant, so the photo-
diode is at equilibrium.
In the absence of illumination, the concentration of electrons on the
p-side, n p0 , is related to the concentration of electrons on the n-side by
the Boltzmann relation:
n p0
= e –(qV Bi /kT) (3.1)
n n0
where V Bi is the built-in voltage of the diode (refer to the book by G.
W. Neudeck in the bibliography for more details). When a bias voltage
V A is applied, the Boltzmann relation still rules, and
n p0 + n
n p
= = e –q[(V Bi –V A )/kT] (3.2)
n n n n
Downloaded from Digital Engineering Library @ McGraw-Hill (www.digitalengineeringlibrary.com)
Copyright © 2004 The McGraw-Hill Companies. All rights reserved.
Any use is subject to the Terms of Use as given at the website.