
Page 269 - Physical Principles of Sedimentary Basin Analysis
P. 269
7.15 Subsidence of the Vøring margin, NE Atlantic 251
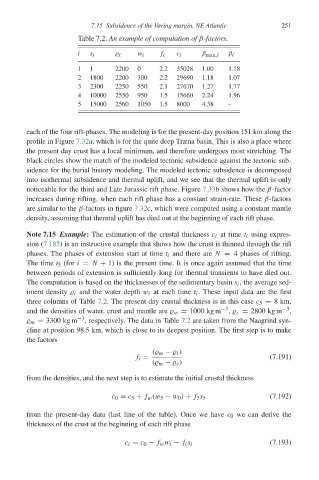
Table 7.2. An example of computation of β-factors.
i s i i w i f i c i β max,i β i
1 1 2200 0 2.2 35028 1.00 1.18
2 1800 2200 300 2.2 29690 1.18 1.07
3 2300 2250 550 2.1 27670 1.27 1.77
4 10000 2550 950 1.5 15660 2.24 1.96
5 15000 2560 1050 1.5 8000 4.38 -
each of the four rift-phases. The modeling is for the present-day position 151 km along the
profile in Figure 7.32a, which is for the quite deep Træna basin. This is also a place where
the present day crust has a local minimum, and therefore undergoes most stretching. The
black circles show the match of the modeled tectonic subsidence against the tectonic sub-
sidence for the burial history modeling. The modeled tectonic subsidence is decomposed
into isothermal subsidence and thermal uplift, and we see that the thermal uplift is only
noticeable for the third and Late Jurassic rift phase. Figure 7.33b shows how the β-factor
increases during rifting, when each rift phase has a constant strain-rate. These β-factors
are similar to the β-factors in figure 7.32c, which were computed using a constant mantle
density, assuming that thermal uplift has died out at the beginning of each rift phase.
Note 7.15 Example: The estimation of the crustal thickness c i at time t i using expres-
sion (7.185) is an instructive example that shows how the crust is thinned through the rift
phases. The phases of extension start at time t i and there are N = 4 phases of rifting.
The time t 5 (for i = N + 1) is the present time. It is once again assumed that the time
between periods of extension is sufficiently long for thermal transients to have died out.
The computation is based on the thicknesses of the sedimentary basin s i , the average sed-
iment density i and the water depth w i at each time t i . These input data are the first
three columns of Table 7.2. The present day crustal thickness is in this case c 5 = 8km,
and the densities of water, crust and mantle are w = 1000 kg m −3 , c = 2800 kg m −3 ,
m = 3300 kg m −3 , respectively. The data in Table 7.2 are taken from the Naagrind syn-
cline at position 98.5 km, which is close to its deepest position. The first step is to make
the factors
( m − i )
f i = (7.191)
( m − c )
from the densities, and the next step is to estimate the initial crustal thickness
c 0 = c 5 + f w (w 5 − w 0 ) + f 5 s 5 (7.192)
from the present-day data (last line of the table). Once we have c 0 we can derive the
thickness of the crust at the beginning of each rift phase
c i = c 0 − f w w i − f i s i (7.193)