Page 204 - Physical Chemistry
P. 204

lev38627_ch06.qxd  3/3/08  10:07 AM  Page 185


                                                                                                                 185
                                                                                                              Section 6.3
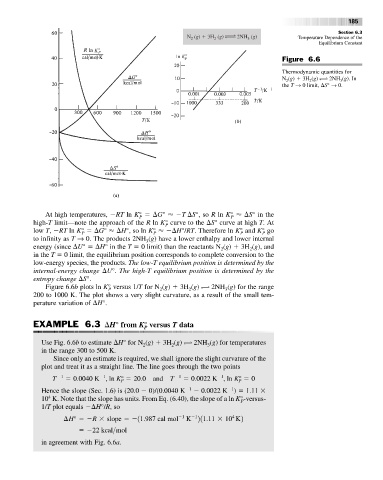
                                                                N  (g)   3H  (g) ∆ 2NH  (g)       Temperature Dependence of the
                                                                                  3
                                                                  2
                                                                        2
                                                                                                        Equilibrium Constant
                                     K  P
                                                                                             Figure 6.6
                                                                                             Thermodynamic quantities for
                                                                                             N (g)   3H (g) ∆ 2NH (g). In
                                                                                                     2
                                                                                              2
                                                                                                              3
                                                                                             the T → 0 limit,  S° → 0.


                      At high temperatures,  RT ln K°   G°    T  S°, so R ln K°    S° in the
                                                                             P
                                                  P
                  high-T limit—note the approach of the R ln K° curve to the  S° curve at high T. At
                                                          P
                  low T,  RT ln K°   G°    H°, so ln K°     H°/RT. Therefore ln K° and K° go
                                                                                       P
                                 P
                                                                                P
                                                      P
                  to infinity as T → 0. The products 2NH (g) have a lower enthalpy and lower internal
                                                    3
                  energy (since  U°   H° in the T   0 limit) than the reactants N (g)   3H (g), and
                                                                          2
                                                                                   2
                  in the T   0 limit, the equilibrium position corresponds to complete conversion to the
                  low-energy species, the products. The low-T equilibrium position is determined by the
                  internal-energy change  U°. The high-T equilibrium position is determined by the
                  entropy change  S°.
                      Figure 6.6b plots ln K° versus 1/T for N (g)   3H (g) ∆ 2NH (g) for the range
                                                                 2
                                         P
                                                                            3
                                                        2
                  200 to 1000 K. The plot shows a very slight curvature, as a result of the small tem-
                  perature variation of  H°.
                  EXAMPLE 6.3  H°from K° versus T data
                                                    P
                     Use Fig. 6.6b to estimate  H° for N (g)   3H (g) ∆ 2NH (g) for temperatures
                                                            2
                                                   2
                                                                      3
                     in the range 300 to 500 K.
                        Since only an estimate is required, we shall ignore the slight curvature of the
                     plot and treat it as a straight line. The line goes through the two points
                                       1
                                                                          1
                        T   1    0.0040 K , ln K°   20.0  and  T   1    0.0022 K , ln K°   0
                                             P
                                                                                P
                                                                              1
                     Hence the slope (Sec. 1.6) is (20.0   0)/(0.0040 K  1    0.0022 K )   1.11
                       4
                     10 K. Note that the slope has units. From Eq. (6.40), the slope of a ln K°-versus-
                                                                                P
                     1/T plot equals   H°/R, so
                                                                              4
                                                                   1
                                                               1
                           ¢H°   R 	 slope   11.987 cal mol  K 211.11 	 10 K2
                                  22 kcal>mol
                     in agreement with Fig. 6.6a.
   199   200   201   202   203   204   205   206   207   208   209