
Page 94 - Practical Ship Design
P. 94
64 Chapter 3
0.9
0.8
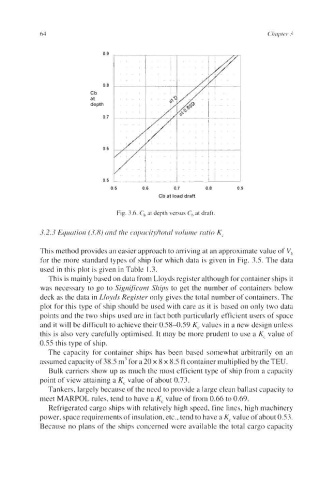
Cb
at
depth
0.7
0.6
0.5
0.5 0.6 0.7 0.8 0.9
Cb at load draft
Fig. 3.6. C, at depth versus C, at draft.
3.2.3 Equation (3.8) and the capacityhotal volume ratio K,
This method provides an easier approach to arriving at an approximate value of V,,
for the more standard types of ship for which data is given in Fig. 3.5. The data
used in this plot is given in Table 1.3.
This is mainly based on data from Lloyds register although for container ships it
was necessary to go to Significant Ships to get the number of containers below
deck as the data in Lloyds Register only gives the total number of containers. The
plot for this type of ship should be used with care as it is based on only two data
points and the two ships used are in fact both particularly efficient users of space
and it will be difficult to achieve their 0.58-0.59 K, values in a new design unless
this is also very carefully optimised. It may be more prudent to use a K, value of
0.55 this type of ship.
The capacity for container ships has been based somewhat arbitrarily on an
assumed capacity of 38.5 m3 for a 20 x 8 x 8.5 ft container multiplied by the TEU.
Bulk carriers show up as much the most efficient type of ship from a capacity
point of view attaining a K, value of about 0.73.
Tankers, largely because of the need to provide a large clean ballast capacity to
meet MARPOL rules, tend to have a K, value of from 0.66 to 0.69.
Refrigerated cargo ships with relatively high speed, fine lines, high machinery
power, space requirements of insulation, etc., tend to have a K, value of about 0.53.
Because no plans of the ships concerned were available the total cargo capacity