
Page 141 - Pressure Swing Adsorption
P. 141
';Ii
116 PRESSURE SWING ADSORPTION EQUILIBRIUM THEORY I 17
its initial composition and the imposed pressure ratJO, (78.03%), oxygen (20.99%). and argon (0.94%) (for 51mplic1tv the mmor
constituents are omitted here). and the temperature 1s taken to be 45°C,
( 4.32) which assures that the isotherms are nearly linear (up to about 6 atm).
Furthermore, the adsorption isotherms of argon and oxygen on SA zeolite
practically coincide, so argon and oxygen are not separated. The
The ultimate axial position, denoted zs, is coupled to the ongmal position z
0 adsorbent-adsorbate mteract1ons are characterized by f3 = 8 = 0.593 (Kayser
by and Knaebel ).
20
Zs= zo(Ys )P/(1-pl/] =Yo )1/0-Pl( I+ (/3 - l}Ys l Two types of compansons are possible: fixmg the extent of purge and
Yo \1 Ys l+(/3-l)y 0 ( 4.33) varying the pressure ratio, or vice versa. The results arc shown in Figures 4.8
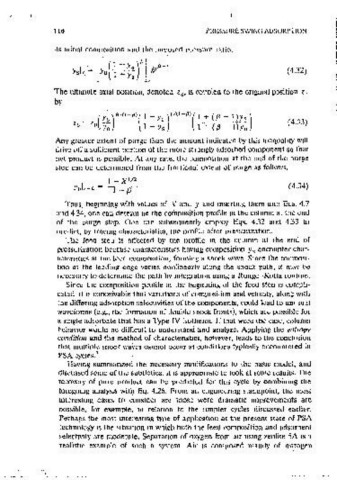
and 4.9, rcspect1vcly. The former shows extents of purge of 100% and ~0%,
Any greater extent of purge than the amount indicated by this inequality will and pressure ratios from 1.45 to 100. The recovery based on complete ourgc
drive off a sufficient portion of the more strongly adsorbed component so that passes the break~even oomt at a pressure ratlO of 4.6, reaches 22% at a
net product 1s possible. At any rate, the comoosition at the end of the ourge pressure ratio of 10, and approaches ahout 39% as the pressure becomes very
step can be determmed from the fractional extent of purge as follows, large. Conversely, at 50% purge the recovery at a pressure ratio of 1.45 1s
23%, rises to neariy 39% at a pressure rat10 of 10, and attains the maximum
1 - X 112
Yol,-L = 1 _ /3 ( 4.34) value of about 40% at a high pressure rat10. Figure 4.9 shows pressure ratios
of 2.0 and 4.0, with extents of purge from 45% to 100%. Both cases show nil
Thus, beginning with values of X and y and mserting them into Eos. 4.7 recovery for high extents of purge, and over 30% recovery as the exteni of
and 4.34, one can determine the composition profile Jil the column at the end purge reaches the mimmurn value for which pure oroduct is attainable.
of the purge step. One can subsequently employ Eqs. 4.32 and 4.33 to To summarize these results: rectucmg the extent of purge to about 50% of
oredict, by tracmg characteristics, tile profile after pressurization. completion allows recovery to pure oxygen at low P:ressure ratios. As the
The feed step is affected by the profile m the column al the end of pressure ratio mcreases, the improvement 1s still significant. though the
pressurizatmn because charactenstics having composition Ys encounter char-
actenstics at the feed .composition, formmg a shock wave. Since the cornnos1-
tlon at the leading edge varies nonlinearly along the shock path, it rnav be 0.5
necessary to determine the path by mtegratmn usmg a Runge-Kutta routrne.
Since the composition profile at the beginning of the feed steo 1s compli-
cated, 1t 1s conceiVable that variations of composition and veiocity, along with ill 0.4
the diffenng adsorption selectivities of the components. could lead to unusual c
•
waveforms (e.g., the format10n of double shock fronts), which are possible for C
0
a.
a smgle adsorbate that has a Type IV isotherm. If that were the case, column E 0.3
0
behavior would be difficult to understand and analyze. Applying the entropy I "
'
condition and the method of characteristics, however, leads to the conciusion I ~
that multiple shock waves cannot occur at conditions typically encountered in • 0.2
PSA cycies. 7 i >- X 100%
w
Havmg summarized the necessary modifications to the basic model, and ' ""
>
discussed some of the subtleties, 1t is appropnate to look at some results. The 0 w
mterestmg cases to consider are those were dramatic 1morovements are I I
'--'
recovery of pure product can be predicted for this cycle by combinmg the "' 0.)
foregomg analysis with Eo. 4.26. From an engmeermg standpoint, the most
possible, for example, m relation to the simpler cycles discussed earlier. 0.0 1 oo 1 0 1 1 0 2
Perhaps the most mterestmg type of application at the present state of PSA i
technology 1s the situation in which both the feed composition and adsorbent fJ ~ pH/ PL
selectivity are moderate. Separation of oxygen from air using zeolite SA 1s a Figure 4.8 Effect on light product recoverv of pressure ratiO, for extents of purge of
realistic examoie of such a system. Air 1s composed mamly of mtrogen 50% and 100%, for {3 ~ 0.593 and y, ~ 11.78.