
Page 198 - Principles of Catalyst Development
P. 198
CATALYST DEACTIVATION 187
overlayer. (256) Much work remains to be done before these concepts are
confirmed.
Nevertheless, trends such as those shown in Fig. 8.1 are observed and
must be regarded as part of a deactivation process in which the surface is
"conditioned." This should not be confused with activation, which is a
well-defined phase change, as in reduction or sulfiding.
Laboratory rate measurement should start with the conditioned catalyst
at steady state. Rapid deactivation thereafter confuses these measurements,
especially with the type of time-consuming experiments used to determine
rate equations. In such cases, it is wise to return to initial conditions at the
end of each run and check for differences. Whenever possible, deactivation
should be avoided or appropriate corrections made in some reasonable
manner. This becomes more difficult when deactivation is rapid.
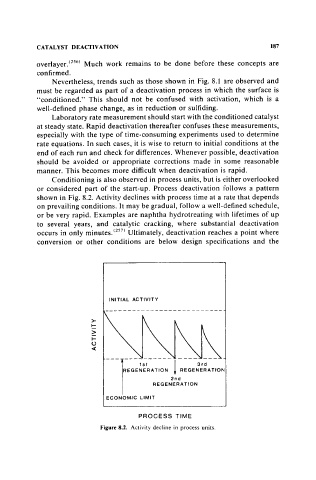
Conditioning is also observed in process units, but is dther overlooked
or considered part of the start-up. Process deactivation follows a pattern
shown in Fig. 8.2. Activity declines with process time at a rate that depends
on prevailing conditions. It may be gradual, follow a well-defined schedule,
or be very rapid. Examples are naphtha hydrotreating wilth lifetimes of up
to several years, and catalytic cracking, where substantial deactivation
occurs in only minutes. (257) Ultimately, deactivation reaches a point where
conversion or other conditions are below design specifications and the
INITIAL ACTIVITY
>-
I-
>
I-
U
c(
---1---------- ---- --- .
1st
3 rd
REGENERATION 1 REGENERATlOIlI
2nd
REGENERATION
ECONOMIC LIMIT
PROCESS TIME
Figure 8.2. Activity decline in process units.