
Page 221 - Principles of Catalyst Development
P. 221
202 Principles of Applied Reservoir Simulation
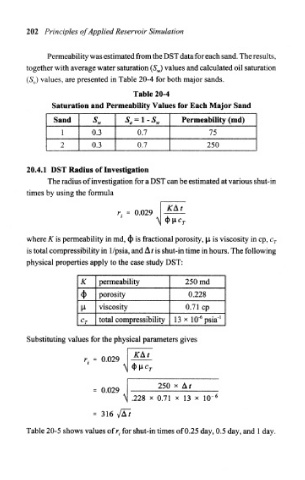
Permeability was estimated from the DST data for each sand. The results,
together with average water saturation (5 W ) values and calculated oil saturation
(S 0) values, are presented in Table 20-4 for both major sands.
Table 20-4
Saturation and Permeability Values for Each Major Sand
Sand s» S. = 1-S W Permeability (nnd)
! 0.3 0.7 75
2 0.3 0.7 250
20.4.1 DST Radius of Investigation
The radius of investigation for a DST can be estimated at various shut-in
times by using the formula
f CAr
r. - 0.029
N <i> »C T
where K is permeability in md, <j> is fractional porosity, |l is viscosity in cp, C T
is total compressibility in 1/psia, and Ads shut-in time in hours. The following
physical properties apply to the case study DST:
K permeability 250 md
<t> porosity 0.228
M- viscosity 0.71 cp
total compressibility 13 x lO^psia 1
C T
Substituting values for the physical parameters gives
Kkt
r. = 0.029
N 4>Hc r
250 x Af
0.02y
^ .228 x 0.71 x 13 x 1Q~ 6
= 316
Table 20-5 shows values of r i for shut-in times of 0.25 day, 0.5 day, and 1 day.