Page 22 - Probability Demystified
P. 22

CHAPTER 1 Basic Concepts                                                    11

                        8. There are 38 outcomes:

                                        18   9
                           a. P(red) =     ¼   .
                                        38   19
                                          2    1
                           b. P(green) =     ¼   .
                                          38   19
                        9. The sample space is 1c=,5c=, 10c=, 25c=, 50c=.
                                        1
                           a. P(25c=) ¼ .
                                        5
                                                   3
                           b. P(greater than 5c=) ¼ .
                                                   5
                                                             2
                            c. P(denomination ends in zero) ¼ .
                                                             5
                      10. The sample space consists of six women and three men.
                                           3   1
                                 PðmanÞ¼    ¼ :
                                           9   3


                                                                   Empirical Probability


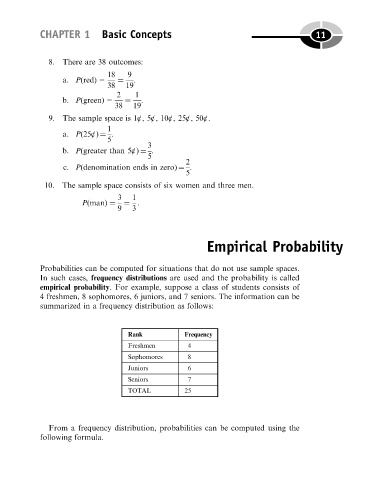
                     Probabilities can be computed for situations that do not use sample spaces.
                     In such cases, frequency distributions are used and the probability is called
                     empirical probability. For example, suppose a class of students consists of
                     4 freshmen, 8 sophomores, 6 juniors, and 7 seniors. The information can be
                     summarized in a frequency distribution as follows:


                                             Rank            Frequency
                                             Freshmen         4
                                             Sophomores       8
                                             Juniors          6
                                             Seniors          7
                                             TOTAL           25


                        From a frequency distribution, probabilities can be computed using the
                     following formula.
   17   18   19   20   21   22   23   24   25   26   27