
Page 377 - Probability and Statistical Inference
P. 377
354 7. Point Estimation
T = 0 for µ. Obviously both are biased estimators of µ. In view of the Theo-
8
rem 7.3.1, the MSE would be ¼(σ + µ ) whereas the MSE would simply
2
2
T7
T 8
2
be µ . Between these two estimators T and T , as far as the smaller MSE
7
∞
criterion goes, T will be deemed better if and only if σ < 3µ .
2
2
7
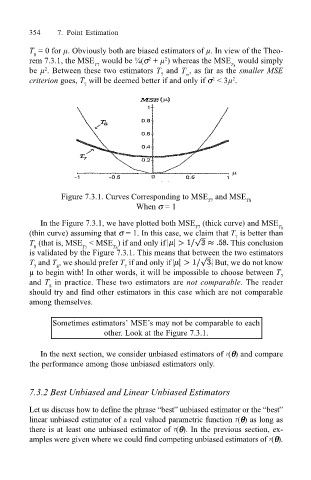
Figure 7.3.1. Curves Corresponding to MSE and MSE T8
T7
When σ = 1
In the Figure 7.3.1, we have plotted both MSE (thick curve) and MSE
T7
T 8
(thin curve) assuming that σ = 1. In this case, we claim that T is better than
7
T (that is, MSE < MSE ) if and only if This conclusion
8
T 7
T 8
is validated by the Figure 7.3.1. This means that between the two estimators
T and T , we should prefer T if and only if But, we do not know
8
7
7
µ to begin with! In other words, it will be impossible to choose between T 7
and T in practice. These two estimators are not comparable. The reader
8
should try and find other estimators in this case which are not comparable
among themselves.
Sometimes estimators MSEs may not be comparable to each
other. Look at the Figure 7.3.1.
In the next section, we consider unbiased estimators of T(θθ θθ θ) and compare
the performance among those unbiased estimators only.
7.3.2 Best Unbiased and Linear Unbiased Estimators
Let us discuss how to define the phrase best unbiased estimator or the best
linear unbiased estimator of a real valued parametric function T(θθ θθ θ) as long as
there is at least one unbiased estimator of T(θθ θθ θ). In the previous section, ex-
amples were given where we could find competing unbiased estimators of T(θθ θθ θ).