Page 581 - Probability and Statistical Inference
P. 581
558    12. Large-Sample Inference

                                 .91661, and hence p lies between .5362 and .6297. We report that between
                                 53.62% and 62.97% of the voters in the town favor the proposed computer-
                                 ization. !

                                       In Examples 12.4.1-12.4.3, the sample size n was so large that
                                        the results obtained after variance stabilization looked nearly
                                              identical to what was found in Section 12.3.1.

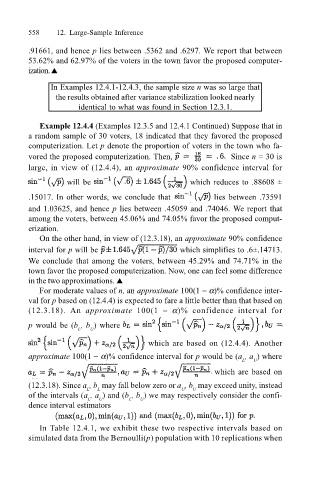
                                    Example 12.4.4 (Examples 12.3.5 and 12.4.1 Continued) Suppose that in
                                 a random sample of 30 voters, 18 indicated that they favored the proposed
                                 computerization. Let p denote the proportion of voters in the town who fa-
                                 vored the proposed computerization. Then,           Since n = 30 is
                                 large, in view of (12.4.4), an approximate 90% confidence interval for

                                            will be                       which reduces to .88608 ±
                                 .15017. In other words, we conclude that        lies between .73591
                                 and 1.03625, and hence p lies between .45059 and .74046. We report that
                                 among the voters, between 45.06% and 74.05% favor the proposed comput-
                                 erization.
                                    On the other hand, in view of (12.3.18), an approximate 90% confidence
                                 interval for p will be                 which simplifies to .6±.14713.
                                 We conclude that among the voters, between 45.29% and 74.71% in the
                                 town favor the proposed computerization. Now, one can feel some difference
                                 in the two approximations. !
                                    For moderate values of n, an approximate 100(1 − α)% confidence inter-
                                 val for p based on (12.4.4) is expected to fare a little better than that based on
                                 (12.3.18). An  approximate 100(1  −  α)% confidence interval for
                                 p would be (b , b ) where
                                              L  U
                                                                which are based on (12.4.4). Another
                                 approximate 100(1 − α)% confidence interval for p would be (a , a ) where
                                                                                       L  U
                                                                                  which are based on
                                 (12.3.18). Since a , b  may fall below zero or a , b  may exceed unity, instead
                                                                           U
                                                   L
                                                                        U
                                                L
                                 of the intervals (a , a ) and (b , b ) we may respectively consider the confi-
                                                L
                                                             U
                                                   U
                                                           L
                                 dence interval estimators
                                    In Table 12.4.1, we exhibit these two respective intervals based on
                                 simulated data from the Bernoulli(p) population with 10 replications when

