
Page 345 - Process Equipment and Plant Design Principles and Practices by Subhabrata Ray Gargi Das
P. 345
11.9 Design illustration e batch distillation 347
Condenser: The condenser is a small shell and tube condenser, cooled with water. Its design can be
carried out using the information in Chapter 4.
Comment: The recovery of 53.1% toluene is rather low, that too with 40% toluene purity. It is
therefore desirable to investigate the option of batch distillation with stages and reflux with around
50% toluene purity. This is illustrated in the following section.
Solution 1B: Batch distillation with constant reflux ratio
The problem is attempted considering batch distillation with stages and constant reflux ratio.
Small-scale distillation would usually employ packed tower for vapoureliquid contacting. Three
theoretical contacting stages in the tower (packed bed) and one stage for the reboiler still is considered.
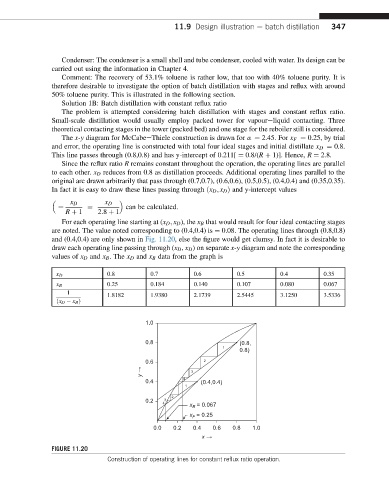
The x-y diagram for McCabeeThiele construction is drawn for a ¼ 2.45. For x F ¼ 0.25, by trial
and error, the operating line is constructed with total four ideal stages and initial distillate x D ¼ 0.8.
This line passes through (0.8,0.8) and has y-intercept of 0.211[ ¼ 0.8/(R þ 1)]. Hence, R ¼ 2.8.
Since the reflux ratio R remains constant throughout the operation, the operating lines are parallel
to each other. x D reduces from 0.8 as distillation proceeds. Additional operating lines parallel to the
original are drawn arbitrarily that pass through (0.7,0.7), (0.6,0.6), (0.5,0.5), (0.4,0.4) and (0.35,0.35).
In fact it is easy to draw these lines passing through ðx D ; x D Þ and y-intercept values
x D x D
can be calculated.
¼ ¼
R þ 1 2:8 þ 1
For each operating line starting at (x D ; x D ), the x B that would result for four ideal contacting stages
are noted. The value noted corresponding to (0.4,0.4) is ¼ 0.08. The operating lines through (0.8,0.8)
and (0.4,0.4) are only shown in Fig. 11.20, else the figure would get clumsy. In fact it is desirable to
draw each operating line passing through (x D , x D ) on separate x-y diagram and note the corresponding
values of x D and x B .The x D and x B data from the graph is
x D 0.8 0.7 0.6 0.5 0.4 0.35
x B 0.25 0.184 0.140 0.107 0.080 0.067
1
1.8182 1.9380 2.1739 2.5445 3.1250 3.5336
ðx D x B Þ
1.0
0.8 (0.8,
1
0.8)
0.6 2
y → 3
4
0.4 (0.4,0.4)
1
2
0.2 3
4
= 0.067
x B
x = 0.25
F
0.0 0.2 0.4 0.6 0.8 1.0
x →
FIGURE 11.20
Construction of operating lines for constant reflux ratio operation.