
Page 40 -
P. 40
22 1 Introduction
What Does “Six Sigma” Mean?
Today the term “Six Sigma” refers to a broad set of tools, techniques and
methods to improve the quality of processes [75]. A typical process im-
provement project using the Six Sigma methodology follows the so-called
DMAIC approach consisting of five steps: (a) Define the problem and set
targets, (b) Measure key performance indicators and collect data, (c) Ana-
lyze the data to investigate and verify cause-and-effect relationships, (d) Im-
prove the current process based on this analysis, and (e) Control the pro-
cess to minimize deviations from the target. Six Sigma was originally de-
veloped by Motorola in the early 1980s and extended by many others.
The term “Six Sigma” refers to the initial goal set by Motorola to min-
imize defects. In fact, the σ in “Six Sigma” refers to the standard devi-
ation of a normal distribution. Given a normal distribution, 68.3% of the
values lie within 1 standard deviation of the mean, i.e., a random draw
from normal distribution with a mean value of μ and a standard devia-
tion of σ has a probability of 0.683 to be in the interval [μ − σ,μ + σ].
Given the same normal distribution, 95.45% of randomly sampled values
lie within two standard deviations of the mean, i.e., [μ − 2σ,μ + 2σ],
and 99.73% of the values lie within three standard deviations of the mean
([μ − 3σ,μ + 3σ]). The traditional quality paradigm in manufacturing de-
fined a process as “capable” if the process’s natural spread, plus and mi-
nus three σ, was less than the engineering tolerance. So, if deviations of
up to three times the standard deviations are allowed, then on average
2700 out of one million cases will have a defect (i.e., samples outside
the [μ − 3σ,μ + 3σ] interval). Six Sigma aims to create processes were
the standard deviation is so small that any value within 6 standard devia-
tions of the mean can be considered as non-defective. In literature, often
a 1.5 sigma shift (to accommodate for long term variations and decreas-
ing quality) is taken into account [75]. This results in the following ta-
ble:
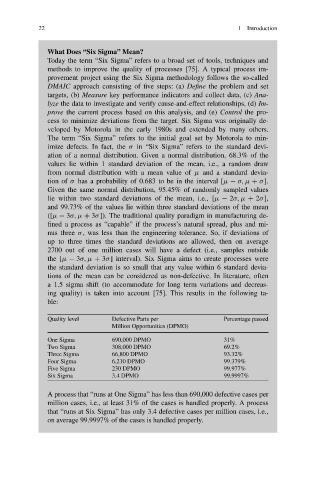
Quality level Defective Parts per Percentage passed
Million Opportunities (DPMO)
One Sigma 690,000 DPMO 31%
Two Sigma 308,000 DPMO 69.2%
Three Sigma 66,800 DPMO 93.32%
Four Sigma 6,210 DPMO 99.379%
Five Sigma 230 DPMO 99.977%
Six Sigma 3.4 DPMO 99.9997%
A process that “runs at One Sigma” has less than 690,000 defective cases per
million cases, i.e., at least 31% of the cases is handled properly. A process
that “runs at Six Sigma” has only 3.4 defective cases per million cases, i.e.,
on average 99.9997% of the cases is handled properly.