
Page 57 - Psychological Management of Individual Performance
P. 57
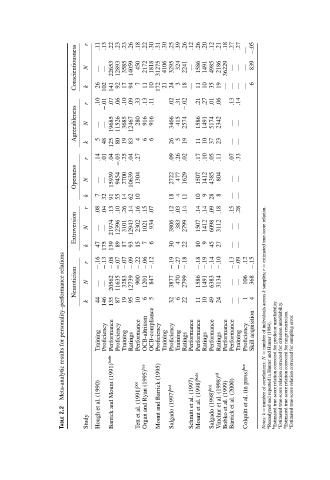
Conscientiousness  r  N  .11  —  .13  —  .22  22653  .23  12893  .23  3585  .26  14059  .18  450  7  .22  2172  .30  1818  .31  31275  .30  4106  .25  3295  .39  324  3  .26  2241  .12  —  .26  1586  .20  1491  .12  4985  .21  2186  .18  36229  .27  —  .27  —  —  —  −.05  839  6


                                       k

                                           .10  26  102  141  .07  92  .06  17  .10  94  .09  .33  11  .13  10  .11  172  21  24  .02  .31  18  —  11  .21  10  .27  35  .01  19  .06  —  —  .13  —  .14  —
                                       r     −.01                   −.02
                                    Agreeableness  N  —  5  —  19685  11526  3685  12467  280  4  916  6  916  6  3466  415  5  2574  1586  1491  5174  2342  —  —


                                       k

                                           .14  48  .01  125  .04  80  19  .25  83  .04  .27  26  .09  .26  19  .02  11  .17  10  .10  37  .05  23  .11  —  .07  —  .33
                                       r        −.03
                                    Openness  N  —  —  15939  9454  2700  10639  1304  2722  477  1629  1507  1412  4385  804  —  —


                                       k   7  32  91  55  14  62  10  18  4  11  10  9  28  8  —  —
                                       r   .08  .04  .13  .10  .26  .14  .16  .15  .07  .12  .03  .14  .14  .14  .09  .18  .15  .28
                                    Extroversion  N  —  —  21974  12396  3101  12943  2302  1021  934  3806  383  2799  1507  1412  6098  3112  —  —


                                       k   47  175  139  89  17  93  15  7  6  30  4  22  10  9  45  27  —  —  samples; r = estimated true-score relation.
                                relations  Neuroticism  r  N  −.16  —  −.13  —  −.08  20562  −.07  11635  −.07  3283  −.09  12739  −.22  900  −.06  1201  −.12  847  −.19  3877  −.27  470  −.18  2799  −.18  1586  −.19  1491  −.14  6383  −.10  3134  −.13  —  −.09  —  .12  106  −.15  368


                                personality–performance  k  44  146  135  87  19  95  10  6  5  32  6  22  11  10  49  24  —  —  1  4 acquisition  = number of individuals across k


                                for        Training  Proficiency  Performance  Proficiency  Training  Ratings  Performance  OCB-altriusm  OCB-compliance  Proficiency  Training  Proficiency  Training  Ratings  Performance  Performance  Ratings  Performance  Ratings  Performance  Performance  Training  Proficiency  Skill
                                results        (1991) bcde                                 N b Estimated true-score relation corrected for predictor unreliability. c Estimated true-score relation corrected for criterion unreliability.

                                Meta-analytic  (1990)  Mount  (1995) bce  (1995)  Barrick  (1997)  (1998) bcde  (1998) cd  (1999)  (2000)  press) bce  (in  a Reanalyzed and reported in Hunter and Hunter (1984). d Estimated true-score relation corrected for range restriction. e Estimated true-score relation corrected for sampling error.


                                           al.  and   (1991) bce  Ryan  (1997) bcd  al.  al.  (1998) bcd  al.  al.  al.  al.  et  Notes: k = number of correlations;
                                2.2        et         al.  et  and  and  et  et  et  et  et
                                TABLE  Study  Hough  Barrick  Tett  Organ  Mount  Salgado  Schmitt  Mount  Salgado  Vinchur  Bobko  Barrick  Colquitt