
Page 404 -
P. 404
394 CHAPTER 13 Measuring the human
LAB-IN-A-BOX—CONT'D
FIGURE 13.9
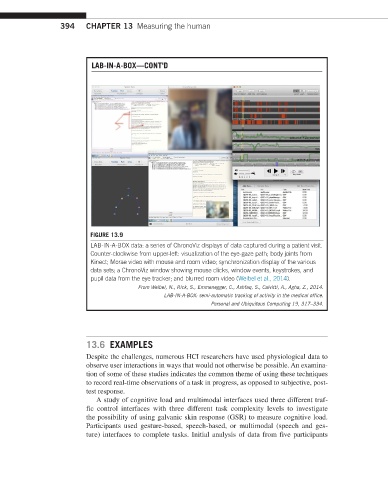
LAB-IN-A-BOX data: a series of ChronoViz displays of data captured during a patient visit.
Counter-clockwise from upper-left: visualization of the eye-gaze path; body joints from
Kinect; Morae video with mouse and room video; synchronization display of the various
data sets; a ChronoViz window showing mouse clicks, window events, keystrokes, and
pupil data from the eye tracker; and blurred room video (Weibel et al., 2014).
From Weibel, N., Rick, S., Emmenegger, C., Ashfaq, S., Calvitti, A., Agha, Z., 2014.
LAB-IN-A-BOX: semi-automatic tracking of activity in the medical office.
Personal and Ubiquitous Computing 19, 317–334.
13.6 EXAMPLES
Despite the challenges, numerous HCI researchers have used physiological data to
observe user interactions in ways that would not otherwise be possible. An examina-
tion of some of these studies indicates the common theme of using these techniques
to record real-time observations of a task in progress, as opposed to subjective, post-
test response.
A study of cognitive load and multimodal interfaces used three different traf-
fic control interfaces with three different task complexity levels to investigate
the possibility of using galvanic skin response (GSR) to measure cognitive load.
Participants used gesture-based, speech-based, or multimodal (speech and ges-
ture) interfaces to complete tasks. Initial analysis of data from five participants