
Page 170 - Reservoir Formation Damage
P. 170
152 Reservoir Formation Damage
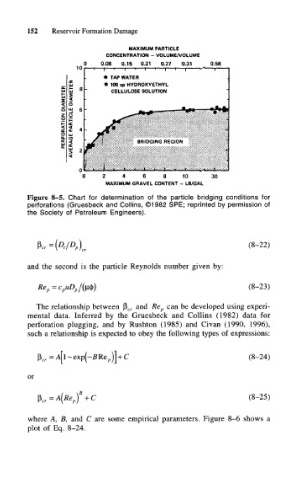
MAXIMUM PARTICLE
CONCENTRATION - VOLUME/VOLUME
0.08 0.15 0.21 0.27 0.31 0.58
10
• TAP WATER
• 100 cp HYDROXYETHYL
CELLULOSE SOLUTION
BRIDGING REGION
2 4 6 8 10 30
MAXIMUM GRAVEL CONTENT - LB/GAL
Figure 8-5. Chart for determination of the particle bridging conditions for
perforations (Gruesbeck and Collins, ©1982 SPE; reprinted by permission of
the Society of Petroleum Engineers).
(8-22)
and the second is the particle Reynolds number given by:
(8-23)
The relationship between (3 cr and Re p can be developed using experi-
mental data. Inferred by the Gruesbeck and Collins (1982) data for
perforation plugging, and by Rushton (1985) and Civan (1990, 1996),
such a relationship is expected to obey the following types of expressions:
(8-24)
or
(8-25)
where A, B, and C are some empirical parameters. Figure 8-6 shows a
plot of Eq. 8-24.