
Page 179 - Reservoir Geomechanics
P. 179
162 Reservoir geomechanics
A
D
B
C
Area of
Figure 5-8
50 km
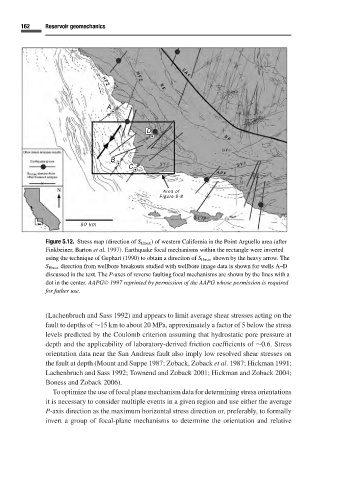
Figure 5.12. Stress map (direction of S Hmax )of western California in the Point Arguello area (after
Finkbeiner, Barton et al. 1997). Earthquake focal mechanisms within the rectangle were inverted
using the technique of Gephart (1990)to obtain a direction of S Hmax shown by the heavy arrow. The
S Hmax direction from wellbore breakouts studied with wellbore image data is shown for wells A–D
discussed in the text. The P-axes of reverse faulting focal mechanisms are shown by the lines with a
dot in the center. AAPG C 1997 reprinted by permission of the AAPG whose permission is required
for futher use.
(Lachenbruch and Sass 1992) and appears to limit average shear stresses acting on the
fault to depths of ∼15 km to about 20 MPa, approximately a factor of 5 below the stress
levels predicted by the Coulomb criterion assuming that hydrostatic pore pressure at
depth and the applicability of laboratory-derived friction coefficients of ∼0.6. Stress
orientation data near the San Andreas fault also imply low resolved shear stresses on
the fault at depth (Mount and Suppe 1987; Zoback, Zoback et al. 1987; Hickman 1991;
Lachenbruch and Sass 1992;Townend and Zoback 2001; Hickman and Zoback 2004;
Boness and Zoback 2006).
To optimize the use of focal plane mechanism data for determining stress orientations
it is necessary to consider multiple events in a given region and use either the average
P-axis direction as the maximum horizontal stress direction or, preferably, to formally
invert a group of focal-plane mechanisms to determine the orientation and relative