
Page 287 - Reservoir Geomechanics
P. 287
−35˚
35˚
70˚
0˚
180˚
180˚
90˚
90˚
0˚
0˚
Map quality B and A only 1.5.Again, Figure in as same the are Colors base. data
Stress
World
the
from
stress
270˚ 270˚ horizontal (http://www-wsm.physik.uni-karlsrohe.de/)
maximum
U of
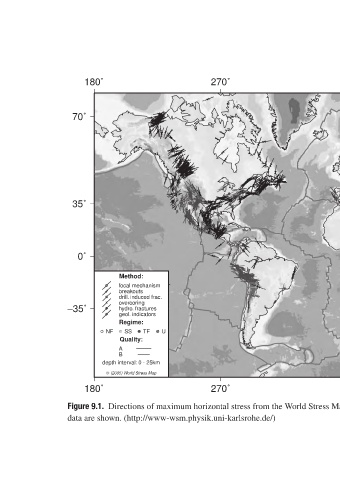
Method: focal mechanism breakouts drill. induced frac. overcoring hydro. fractures geol. indicators Regime: TF SS Quality: depth interval: 0 - 25km (2005) World Stress Map Directions
NF A B shown.
180˚ 180˚ 9.1. are
70˚ 35˚ 0˚ −35˚ Figure data