
Page 107 - Rock Mechanics For Underground Mining
P. 107
BEHAVIOUR OF ISOTROPIC ROCK MATERIAL IN UNIAXIAL COMPRESSION
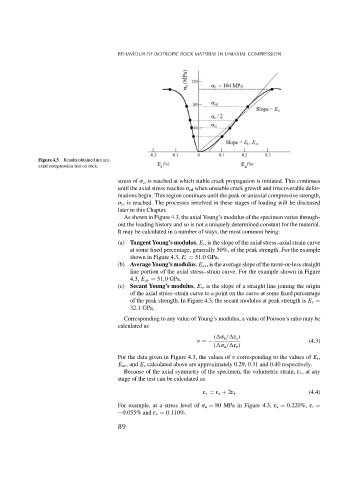
Figure4.3 Resultsobtainedinauni-
axial compression test on rock.
stress of ci is reached at which stable crack propagation is initiated. This continues
until the axial stress reaches cd when unstable crack growth and irrecoverable defor-
mations begin. This region continues until the peak or uniaxial compressive strength,
c , is reached. The processes involved in these stages of loading will be discussed
later in this Chapter.
As shown in Figure 4.3, the axial Young’s modulus of the specimen varies through-
out the loading history and so is not a uniquely determined constant for the material.
It may be calculated in a number of ways, the most common being:
(a) Tangent Young’s modulus, E t , is the slope of the axial stress–axial strain curve
at some fixed percentage, generally 50%, of the peak strength. For the example
shown in Figure 4.3, E t = 51.0GPa.
(b) Average Young’s modulus, E av , is the average slope of the more-or-less straight
line portion of the axial stress–strain curve. For the example shown in Figure
4.3, E av = 51.0GPa.
(c) Secant Young’s modulus, E s , is the slope of a straight line joining the origin
of the axial stress–strain curve to a point on the curve at some fixed percentage
of the peak strength. In Figure 4.3, the secant modulus at peak strength is E s =
32.1GPa.
Corresponding to any value of Young’s modulus, a value of Poisson’s ratio may be
calculated as
( a / ε a )
=− (4.3)
( a / ε r )
For the data given in Figure 4.3, the values of corresponding to the values of E t ,
E av , and E s calculated above are approximately 0.29, 0.31 and 0.40 respectively.
Because of the axial symmetry of the specimen, the volumetric strain, ε v ,atany
stage of the test can be calculated as
(4.4)
ε v = ε a + 2ε r
For example, at a stress level of a = 80 MPa in Figure 4.3, ε a = 0.220%, ε r =
−0.055% and ε v = 0.110%.
89