
Page 113 - Root Cause Failure Analysis
P. 113
104 Root Cause Failure Analysis
CFM, TmxfiiANDS
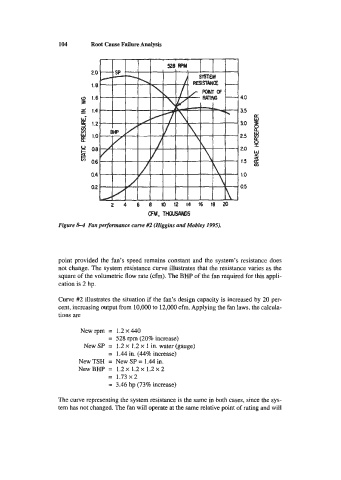
Figure 8-4 Fan performance curve #2 (Higgins and Mobley 1995).
point provided the fan’s speed remains constant and the system’s resistance does
not change. The system resistance curve illustrates that the resistance varies as the
square of the volumetric flow rate (cfm). The BHP of the fan required for this appli-
cation is 2 hp.
Curve #2 illustrates the situation if the fan’s design capacity is increased by 20 per-
cent, increasing output from 10,OOO to 12,000 cfm. Applying the fan laws, the calcula-
tions are
Newrpm = 1.2 x 4.40
-
- 528 rpm (20% increase)
NewSP = 1.2 x 1.2 x 1 in. water (gauge)
-
- 1.44 in. (44% increase)
NewTSH = New SP = 1.44 in.
NewBHF’ = 1.2 x 1.2 x 1.2 x 2
-
- 1.73 x 2
-
- 3.46 hp (73% increase)
The curve representing the system resistance is the same in both cases, since the sys-
tem has not changed. The fan will operate at the same relative point of rating and will