
Page 180 - Safety Risk Management for Medical Devices
P. 180
Risk Estimation 159
Table 17.4 Example five-level definitions for probability
Rank Term Definition
5 Frequent $ 10 23
23 24
4 Probable , 10 and $ 10
3 Occasional , 10 24 and $ 10 25
2 Remote , 10 25 and $ 10 26
1 Improbable , 10 26
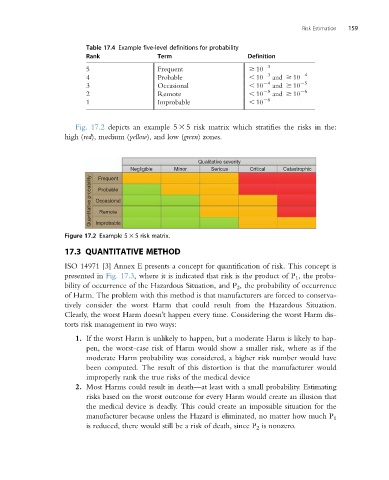
Fig. 17.2 depicts an example 5 3 5 risk matrix which stratifies the risks in the:
high (red), medium (yellow), and low (green) zones.
Qualitative severity
Negligible Minor Serious Critical Catastrophic
Quantitative probability Occasional
Frequent
Probable
Remote
Improbable
Figure 17.2 Example 5 3 5 risk matrix.
17.3 QUANTITATIVE METHOD
ISO 14971 [3] Annex E presents a concept for quantification of risk. This concept is
presented in Fig. 17.3, where it is indicated that risk is the product of P 1 , the proba-
bility of occurrence of the Hazardous Situation, and P 2 , the probability of occurrence
of Harm. The problem with this method is that manufacturers are forced to conserva-
tively consider the worst Harm that could result from the Hazardous Situation.
Clearly, the worst Harm doesn’t happen every time. Considering the worst Harm dis-
torts risk management in two ways:
1. If the worst Harm is unlikely to happen, but a moderate Harm is likely to hap-
pen, the worst-case risk of Harm would show a smaller risk, where as if the
moderate Harm probability was considered, a higher risk number would have
been computed. The result of this distortion is that the manufacturer would
improperly rank the true risks of the medical device
2. Most Harms could result in death—at least with a small probability. Estimating
risks based on the worst outcome for every Harm would create an illusion that
the medical device is deadly. This could create an impossible situation for the
manufacturer because unless the Hazard is eliminated, no matter how much P 1
is reduced, there would still be a risk of death, since P 2 is nonzero.