
Page 41 - Safety Risk Management for Medical Devices
P. 41
20 Safety Risk Management for Medical Devices
(people/property/the environment) can be harmed. This probability is called P 2 .
The product of P 1 and P 2 is risk. Another way to interpret this is as follows.
Risk is the probability of sustaining Harm in a Hazardous Situation
Notice that in Fig. 4.1 there is a dotted line around the [Severity of the Harm] and
[Probability of occurrence of Harm]. The reason for this is that given the same
Hazardous Situation, different people (subjects) experience different degrees of harm.
For example, when exposed to the flu virus, some people with a strong immune sys-
tem may experience nothing, while others may show the typical symptoms of fever
and aches, and some people might even die from the flu. Without prescribing how to
address these different degrees of harm, the Standard [3,7] leaves the door open for
the manufacturer to choose how to address this phenomenon.
Traditionally, many manufacturers take the conservative route and assume the
worst-case Harm. This creates two problems. First, for many Harms there is a chance,
though small, that the patient may die. Manufacturers who use this strategy find
themselves facing an exaggerated picture of the hazards of their device—a picture that
seemingly shows patients could die due to most of the Hazards related to the device,
even though historical data shows otherwise. Those manufacturers find themselves
forced to overdesign their devices, wasting a lot of engineering resources. The second
problem is that resources are then spent on the highest-severity Harms based on
worst-case analysis, while moderate severity Harms that are actually more probable,
get less attention. This means a lower risk Harm would get priority over a higher risk
Harm. Remember risk 5 P 1 3 P 2 .
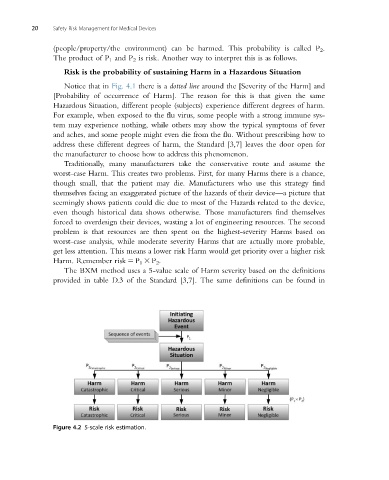
The BXM method uses a 5-value scale of Harm severity based on the definitions
provided in table D.3 of the Standard [3,7]. The same definitions can be found in
Figure 4.2 5-scale risk estimation.