
Page 165 - Satellite Communications, Fourth Edition
P. 165
Antennas 145
actual power P rad radiated by the real antenna is used, rather than the
power P supplied to the antenna. These two values are related as
S
P rad P S , where A is the antenna efficiency. Denoting the directiv-
A
ity by d gives G d.
A
Often, the directivity is the parameter which can be calculated, and
the efficiency is assumed to be equal to unity so that the power gain is
does not include feeder mismatch or polar-
also known. Note that A
ization losses, which are accounted for separately.
The power gain G as defined by Eq. (6.5) is called the isotropic power
gain, sometimes denoted by G . The power gain of an antenna also may
i
be referred to some standard other than isotropic. For example, the
gain of a reflector-type antenna may be stated relative to the antenna
illuminating the reflector. Care must be taken therefore to know what
reference antenna is being used when gain is stated. The isotropic gain
is the most commonly used figure and will be assumed throughout this
text (without use of a subscript) unless otherwise noted.
6.7 Radiation Pattern
The radiation pattern shows how the gain of an antenna varies with
direction. Referring to Fig. 6.3, at a fixed distance r, the gain will vary
with
and and may be written generally as G(
, ). The radiation pat-
tern is the gain normalized to its maximum value. Denoting the maxi-
mum value simply by G [as given by Eq. (6.5)] the radiation pattern is
G(
, )
g(
, ) (6.6)
G
The radiation pattern gives the directional properties of the antenna
normalized to the maximum value, in this case the maximum gain. The
same function gives the power density normalized to the maximum
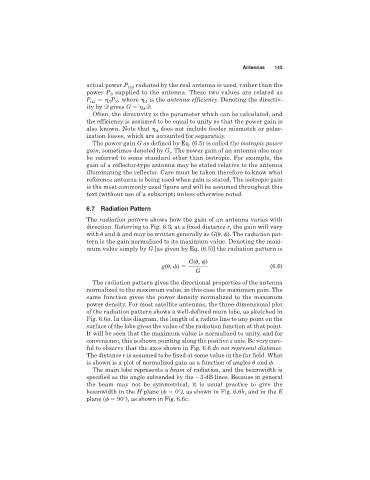
power density. For most satellite antennas, the three-dimensional plot
of the radiation pattern shows a well-defined main lobe, as sketched in
Fig. 6.6a. In this diagram, the length of a radius line to any point on the
surface of the lobe gives the value of the radiation function at that point.
It will be seen that the maximum value is normalized to unity, and for
convenience, this is shown pointing along the positive z axis. Be very care-
ful to observe that the axes shown in Fig. 6.6 do not represent distance.
The distance r is assumed to be fixed at some value in the far field. What
is shown is a plot of normalized gain as a function of angles
and .
The main lobe represents a beam of radiation, and the beamwidth is
specified as the angle subtended by the 3-dB lines. Because in general
the beam may not be symmetrical, it is usual practice to give the
beamwidth in the H plane ( 0°), as shown in Fig. 6.6b, and in the E
plane ( 90°), as shown in Fig. 6.6c.