
Page 32 - Schaum's Outline of Theory and Problems of Signals and Systems
P. 32
CHAP. 11 SIGNALS AND SYSTEMS
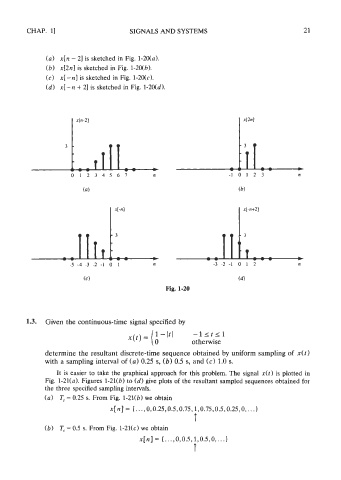
(a) x[n - 21 is sketched in Fig. 1-20(a).
(b) x[2n] is sketched in Fig. 1-20(b).
(c) x[-n] is sketched in Fig. 1-2Nc).
(d) x[-n + 21 is sketched in Fig. 1-2Nd).
(4
Fig. 1-20
13. Given the continuous-time signal specified by
x(t) = (A - It' -1lfll
otherwise
determine the resultant discrete-time sequence obtained by uniform sampling of x(t)
with a sampling interval of (a) 0.25 s, (b) 0.5 s, and (c) 1.0 s.
It is easier to take the graphical approach for this problem. The signal x(t) is plotted in
Fig. 1-21(a). Figures 1-21(b) to (dl give plots of the resultant sampled sequences obtained for
the three specified sampling intervals.
(a) T, = 0.25 s. From Fig. 1-21(b) we obtain
x[n] = (. . . ,0,0.25,0.5,0.75,1,0.75,0.5,0.25,0,. . .)
T
(b) T, = 0.5 s. From Fig. 1-21(c) we obtain
x[n]= { ..., 0,0.5,1,0.5,0 ,...I
T