
Page 68 - Schaum's Outlines - Probability, Random Variables And Random Processes
P. 68
CHAP. 21 RANDOM VARIABLES
fdx)
0 1 2 3 4 X
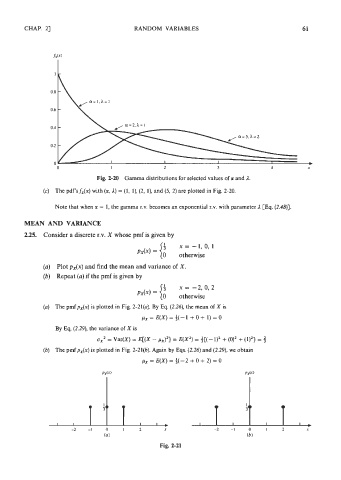
Fig. 2-20 Gamma distributions for selected values of a and I.
(c) The pdf's fx(x) with (a, I) = (1, I), (2, I), and (5, 2) are plotted in Fig. 2-20.
Note that when a = 1, the gamma r.v. becomes an exponential r.v. with parameter 1 [Eq. (2.48)].
MEAN AND VARIANCE
2.25. Consider a discrete r.v. X whose pmf is given by
(a) Plot p,(x) and find the mean and variance of X.
(b) Repeat (a) if the pmf is given by
(a) The pmf p,(x) is plotted in Fig. 2-21(a). By Eq. (2.26), the mean of X is
p, = E(X) = #(- 1 + 0 + 1) = 0
By Eq. (2.29), the variance of X is
ax2 = Var(X) = E[(X - px)2] = E(X2) = $[(- 112 + (0)2 + = 3
(b) The pmf px(x) is plotted in Fig. 2-21(b). Again by Eqs. (2.26) and (2.29), we obtain
px=E(X)=f(-2+0+2)=O
Fig. 2-21