
Page 38 - Sedimentology and Stratigraphy
P. 38
Compositor
Nichols/Sedimentology and Stratigraphy 9781405193795_4_002
Name:
Name:
Nichols/Sedimentology
Compositor
and
Nichols/Sedimentology
page
25
25
26.2.2009
26.2.2009 8:14pm Compositor Name: ARaju
26.2.2009
8:14pm
8:14pm
ARaju
ARaju
02
02
Proof
Final Proof page 25
Proof
Final
Final
Stratigraphy
Stratigraphy
and
9781405193795_4_0
page
9781405193795_4_0
Textures and Analysis of Terrigenous Clastic Sedimentary Rocks 25
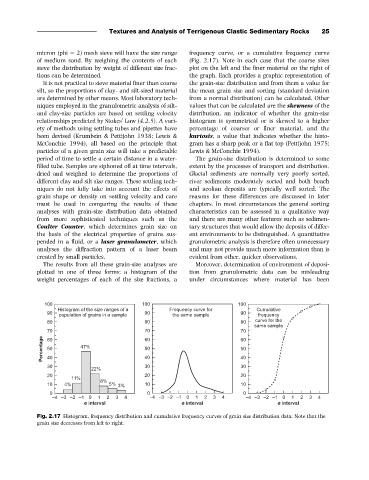
micron (phi ¼ 2) mesh sieve will have the size range frequency curve, or a cumulative frequency curve
of medium sand. By weighing the contents of each (Fig. 2.17). Note in each case that the coarse sizes
sieve the distribution by weight of different size frac- plot on the left and the finer material on the right of
tions can be determined. the graph. Each provides a graphic representation of
It is not practical to sieve material finer than coarse the grain-size distribution and from them a value for
silt, so the proportions of clay- and silt-sized material the mean grain size and sorting (standard deviation
are determined by other means. Most laboratory tech- from a normal distribution) can be calculated. Other
niques employed in the granulometric analysis of silt- values that can be calculated are the skewness of the
and clay-size particles are based on settling velocity distribution, an indicator of whether the grain-size
relationships predicted by Stokes’ Law (4.2.5). A vari- histogram is symmetrical or is skewed to a higher
ety of methods using settling tubes and pipettes have percentage of coarser or finer material, and the
been devised (Krumbein & Pettijohn 1938; Lewis & kurtosis, a value that indicates whether the histo-
McConchie 1994), all based on the principle that gram has a sharp peak or a flat top (Pettijohn 1975;
particles of a given grain size will take a predictable Lewis & McConchie 1994).
period of time to settle a certain distance in a water- The grain-size distribution is determined to some
filled tube. Samples are siphoned off at time intervals, extent by the processes of transport and distribution.
dried and weighed to determine the proportions of Glacial sediments are normally very poorly sorted,
different clay and silt size ranges. These settling tech- river sediments moderately sorted and both beach
niques do not fully take into account the effects of and aeolian deposits are typically well sorted. The
grain shape or density on settling velocity and care reasons for these differences are discussed in later
must be used in comparing the results of these chapters. In most circumstances the general sorting
analyses with grain-size distribution data obtained characteristics can be assessed in a qualitative way
from more sophisticated techniques such as the and there are many other features such as sedimen-
Coulter Counter, which determines grain size on tary structures that would allow the deposits of differ-
the basis of the electrical properties of grains sus- ent environments to be distinguished. A quantitative
pended in a fluid, or a laser granulometer, which granulometric analysis is therefore often unnecessary
analyses the diffraction pattern of a laser beam and may not provide much more information than is
created by small particles. evident from other, quicker observations.
The results from all these grain-size analyses are Moreover, determination of environment of deposi-
plotted in one of three forms: a histogram of the tion from granulometric data can be misleading
weight percentages of each of the size fractions, a under circumstances where material has been
.22 .22 .22
?
8 5 6
6
32
32
32 8 5
-2 -2 -2 6
/2 /2 /2
3 *2 0/F *2 *2
+2
+2
+2
02
02
02
12 ))F 12 12
)2 )2 )2
..F -F
.2 0F *F 1F .2 .2
2 2 2
,0 ,1 ,) ,. 2 . ) 1 0 ,0 ,1 ,) ,. 2 . ) 1 0 ,0 ,1 ,) ,. 2 . ) 1 0
2 2 2
Fig. 2.17 Histogram, frequency distribution and cumulative frequency curves of grain size distribution data. Note that the
grain size decreases from left to right.