
Page 401 - Sensing, Intelligence, Motion : How Robots and Humans Move in an Unstructured World
P. 401
376 HUMAN PERFORMANCE IN MOTION PLANNING
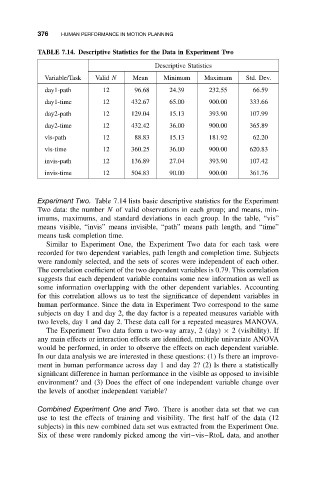
TABLE 7.14. Descriptive Statistics for the Data in Experiment Two
Descriptive Statistics
Variable/Task Valid N Mean Minimum Maximum Std. Dev.
day1-path 12 96.68 24.39 232.55 66.59
day1-time 12 432.67 65.00 900.00 333.66
day2-path 12 129.04 15.13 393.90 107.99
day2-time 12 432.42 36.00 900.00 365.89
vis-path 12 88.83 15.13 181.92 62.20
vis-time 12 360.25 36.00 900.00 620.83
invis-path 12 136.89 27.04 393.90 107.42
invis-time 12 504.83 90.00 900.00 361.76
Experiment Two. Table 7.14 lists basic descriptive statistics for the Experiment
Two data: the number N of valid observations in each group; and means, min-
imums, maximums, and standard deviations in each group. In the table, “vis”
means visible, “invis” means invisible, “path” means path length, and “time”
means task completion time.
Similar to Experiment One, the Experiment Two data for each task were
recorded for two dependent variables, path length and completion time. Subjects
were randomly selected, and the sets of scores were independent of each other.
The correlation coefficient of the two dependent variables is 0.79. This correlation
suggests that each dependent variable contains some new information as well as
some information overlapping with the other dependent variables. Accounting
for this correlation allows us to test the significance of dependent variables in
human performance. Since the data in Experiment Two correspond to the same
subjects on day 1 and day 2, the day factor is a repeated measures variable with
two levels, day 1 and day 2. These data call for a repeated measures MANOVA.
The Experiment Two data form a two-way array, 2 (day) × 2 (visibility). If
any main effects or interaction effects are identified, multiple univariate ANOVA
would be performed, in order to observe the effects on each dependent variable.
In our data analysis we are interested in these questions: (1) Is there an improve-
ment in human performance across day 1 and day 2? (2) Is there a statistically
significant difference in human performance in the visible as opposed to invisible
environment? and (3) Does the effect of one independent variable change over
the levels of another independent variable?
Combined Experiment One and Two. There is another data set that we can
use to test the effects of training and visibility. The first half of the data (12
subjects) in this new combined data set was extracted from the Experiment One.
Six of these were randomly picked among the virt–vis–RtoL data, and another