
Page 167 - Serious Incident Prevention How to Achieve and Sustain Accident-Free Operations in Your Plant or Company
P. 167
CH12pp126-140 4/10/02 12:51 PM Page 138
138
15
20
20
6
4
7
78
52
92
100
100
15
97
95
20
94
25
90
90
85
30
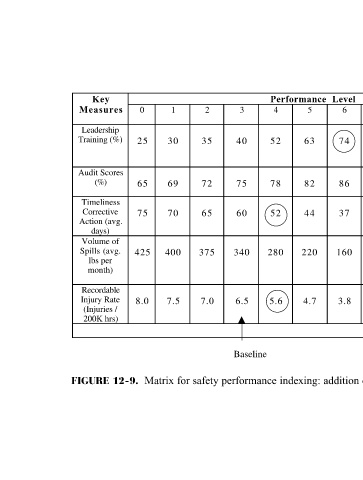
Level Calculations Level x Weight = Value 10 9 8 7 6 Score Serious Incident Prevention 25 7 75 10 40 70 100 160 20 4 5.2 1.5 2.0 2.5 3.0 3.8 TOTAL SCORE = Stretch Goal Goal Matrix for safety performance indexing: addition of values and levels for performing calculations.
37
74
86
Performance 5 4 63 52 82 78 44 52 220 280 4.7 5.6
3 40 75 60 340 6.5 Baseline
12 35 30 72 69 65 70 375 400 7.0 7.5
0 25 65 75 425 8.0
Key Measures Leadership Training (%) Audit Scores (%) Timeliness Corrective Action (avg. days) Volume of Spills (avg. lbs per month) Recordable Injury Rate (Injuries / 200K hrs) FIGURE 12-9.