
Page 240 -
P. 240
CHAPTER 8 SOFTWARE QUALITY ASSURANCE 211
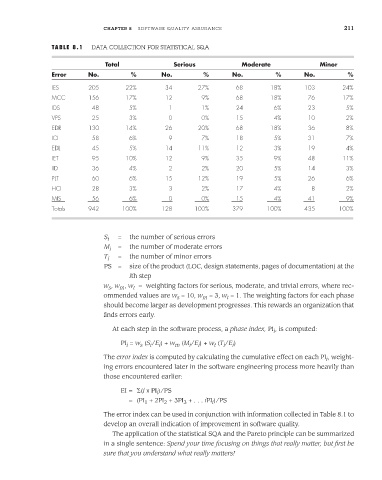
TABLE 8.1 DATA COLLECTION FOR STATISTICAL SQA
Total Serious Moderate Minor
Error No. % No. % No. % No. %
IES 205 22% 34 27% 68 18% 103 24%
MCC 156 17% 12 9% 68 18% 76 17%
IDS 48 5% 1 1% 24 6% 23 5%
VPS 25 3% 0 0% 15 4% 10 2%
EDR 130 14% 26 20% 68 18% 36 8%
ICI 58 6% 9 7% 18 5% 31 7%
EDL 45 5% 14 11% 12 3% 19 4%
IET 95 10% 12 9% 35 9% 48 11%
IID 36 4% 2 2% 20 5% 14 3%
PLT 60 6% 15 12% 19 5% 26 6%
HCI 28 3% 3 2% 17 4% 8 2%
MIS 56 6% 0 0% 15 4% 41 9%
Totals 942 100% 128 100% 379 100% 435 100%
S i = the number of serious errors
M i = the number of moderate errors
T i = the number of minor errors
PS = size of the product (LOC, design statements, pages of documentation) at the
ith step
w , w , w = weighting factors for serious, moderate, and trivial errors, where rec-
s
t
m
ommended values are w = 10, w m = 3, w = 1. The weighting factors for each phase
t
s
should become larger as development progresses. This rewards an organization that
finds errors early.
At each step in the software process, a phase index, PI , is computed:
i
PI = w (S /E ) + w m (M /E ) + w (T /E )
i
i
i
i
s
t
i
i
i
The error index is computed by calculating the cumulative effect on each PI , weight-
i
ing errors encountered later in the software engineering process more heavily than
those encountered earlier:
EI = (i x PI )/PS
i
= (PI + 2PI + 3PI + . . . iPI )/PS
i
3
2
1
The error index can be used in conjunction with information collected in Table 8.1 to
develop an overall indication of improvement in software quality.
The application of the statistical SQA and the Pareto principle can be summarized
in a single sentence: Spend your time focusing on things that really matter, but first be
sure that you understand what really matters!