
Page 86 - Software and Systems Requirements Engineering in Practice
P. 86
i
t
e
r
p
g
h
a
n
n
R
m
e
e
t
i
q
u
c
i
l
C C h a p t e r 3 : E E l i c i t i n g R e q u i r e m e n t s 57 57
s
i
r
t
e
:
3
techniques are decision tables and state tables. Decision tables are
most often used where there are discrete sets of conditions that can
be determined with a “yes” or “no,” actions to take if the conditions
are met, and a set of rules, where each unique set of conditions and
the action to take is one rule.
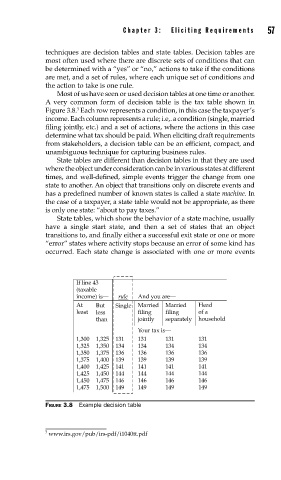
Most of us have seen or used decision tables at one time or another.
A very common form of decision table is the tax table shown in
Figure 3.8. Each row represents a condition, in this case the taxpayer’s
3
income. Each column represents a rule; i.e,. a condition (single, married
filing jointly, etc.) and a set of actions, where the actions in this case
determine what tax should be paid. When eliciting draft requirements
from stakeholders, a decision table can be an efficient, compact, and
unambiguous technique for capturing business rules.
State tables are different than decision tables in that they are used
where the object under consideration can be in various states at different
times, and well-defined, simple events trigger the change from one
state to another. An object that transitions only on discrete events and
has a predefined number of known states is called a state machine. In
the case of a taxpayer, a state table would not be appropriate, as there
is only one state: “about to pay taxes.”
State tables, which show the behavior of a state machine, usually
have a single start state, and then a set of states that an object
transitions to, and finally either a successful exit state or one or more
“error” states where activity stops because an error of some kind has
occurred. Each state change is associated with one or more events
If line 43
(taxable
income) is— rule And you are—
At But Single Married Married Head
least less filing filing of a
than jointly separately household
Your tax is—
1,300 1,325 131 131 131 131
1,325 1,350 134 134 134 134
1,350 1,375 136 136 136 136
1,375 1,400 139 139 139 139
1,400 1,425 141 141 141 141
1,425 1,450 144 144 144 144
1,450 1,475 146 146 146 146
1,475 1,500 149 149 149 149
FIGURE 3.8 Example decision table
3 www.irs.gov/pub/irs-pdf/i1040tt.pdf