
Page 195 - Soil and water contamination, 2nd edition
P. 195
182 Soil and Water Contamination
a b
6642
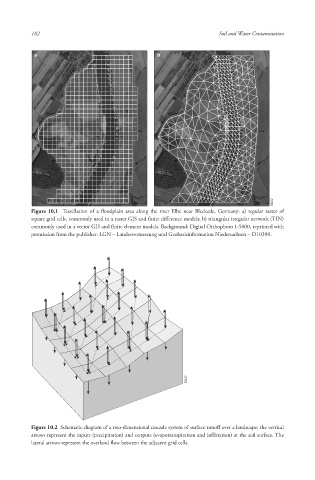
Figure 10.1 Tessellation of a floodplain area along the river Elbe near Bleckede, Germany: a) regular raster of
square grid cells, commonly used in a raster GIS and finite difference models; b) triangular irregular network (TIN)
commonly used in a vector GIS and finite element models. Background: Digital Orthophoto 1:5000, reprinted with
permission from the publisher: LGN – Landesvermessung und Geobasisinformation Niedersachsen – D10390.
6642 6642 6642
Figure 10.2 Schematic diagram of a two-dimensional cascade system of surface runoff over a landscape: the vertical
arrows represent the inputs (precipitation) and outputs (evapotranspiration and infiltration) at the soil surface. The
lateral arrows represent the overland flow between the adjacent grid cells.
10/1/2013 6:44:41 PM
Soil and Water.indd 194 10/1/2013 6:44:41 PM
Soil and Water.indd 194