
Page 234 - Soil and water contamination, 2nd edition
P. 234
Substance transport 221
a b
6642 6642 6642
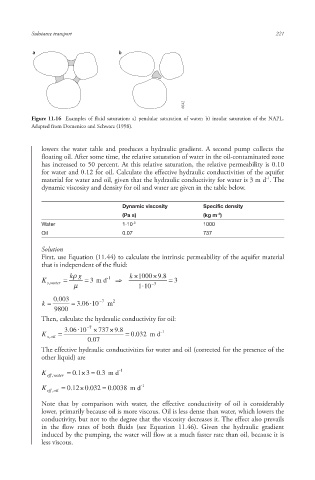
Figure 11.16 Examples of fluid saturation: a) pendular saturation of water; b) insular saturation of the NAPL.
Adapted from Domenico and Schwarz (1998).
lowers the water table and produces a hydraulic gradient. A second pump collects the
floating oil. After some time, the relative saturation of water in the oil-contaminated zone
has increased to 50 percent. At this relative saturation, the relative permeability is 0.10
for water and 0.12 for oil. Calculate the effective hydraulic conductivities of the aquifer
-1
material for water and oil, given that the hydraulic conductivity for water is 3 m d . The
dynamic viscosity and density for oil and water are given in the table below.
Dynamic viscosity Specific density
-3
(Pa s) (kg m )
Water 1·10 -3 1000
Oil 0.07 737
Solution
First, use Equation (11.44) to calculate the intrinsic permeability of the aquifer material
that is independent of the fluid:
k g -1 k 1000 8 . 9
K s ,water 3 m d 3
M 1 10 3
. 0 003 7 2
k . 3 06 10 m
9800
Then, calculate the hydraulic conductivity for oil:
. 3 06 10 7 737 8 . 9 -1
K . 0 032 m d
s ,oil
. 0 07
The effective hydraulic conductivities for water and oil (corrected for the presence of the
other liquid) are
K 1 . 0 3 3 . 0 m d -1
eff , water
K eff , oil . 0 12 . 0 032 . 0 0038 m d -1
Note that by comparison with water, the effective conductivity of oil is considerably
lower, primarily because oil is more viscous. Oil is less dense than water, which lowers the
conductivity, but not to the degree that the viscosity decreases it. The effect also prevails
in the flow rates of both fluids (see Equation 11.46). Given the hydraulic gradient
induced by the pumping, the water will flow at a much faster rate than oil, because it is
less viscous.
10/1/2013 6:45:03 PM
Soil and Water.indd 233 10/1/2013 6:45:03 PM
Soil and Water.indd 233