
Page 130 - Solar Power in Building Design The Engineer's Complete Design Resource
P. 130
100 INTRODUCTION TO SOLAR POWER SYSTEM DESIGN
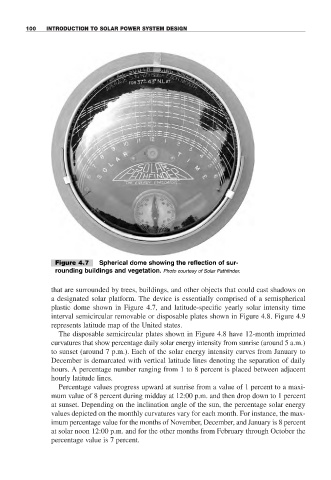
Figure 4.7 Spherical dome showing the reflection of sur-
rounding buildings and vegetation. Photo courtesy of Solar Pathfinder.
that are surrounded by trees, buildings, and other objects that could cast shadows on
a designated solar platform. The device is essentially comprised of a semispherical
plastic dome shown in Figure 4.7, and latitude-specific yearly solar intensity time
interval semicircular removable or disposable plates shown in Figure 4.8. Figure 4.9
represents latitude map of the United states.
The disposable semicircular plates shown in Figure 4.8 have 12-month imprinted
curvatures that show percentage daily solar energy intensity from sunrise (around 5 a.m.)
to sunset (around 7 p.m.). Each of the solar energy intensity curves from January to
December is demarcated with vertical latitude lines denoting the separation of daily
hours. A percentage number ranging from 1 to 8 percent is placed between adjacent
hourly latitude lines.
Percentage values progress upward at sunrise from a value of 1 percent to a maxi-
mum value of 8 percent during midday at 12:00 p.m. and then drop down to 1 percent
at sunset. Depending on the inclination angle of the sun, the percentage solar energy
values depicted on the monthly curvatures vary for each month. For instance, the max-
imum percentage value for the months of November, December, and January is 8 percent
at solar noon 12:00 p.m. and for the other months from February through October the
percentage value is 7 percent.