
Page 179 - Solar Power in Building Design The Engineer's Complete Design Resource
P. 179
A FEW WORDS ABOUT POWER GENERATION AND DISTRIBUTION EFFICIENCY 149
TABLE 6.2 SOLAR POWER AND FOSSIL FUEL POWER GENERATION
COMPARISON TABLE
SOLAR ELECTRIC POWER FOSSIL FUEL ELECTRIC POWER
Delivery efficiency Above 90% Less than 30%
Maintenance Very minimal Considerable
Transmission lines None required Very extensive
Equipment life span 25–45 years Maximum of 25 years
Investment payback 8–14 years 20–25 years
Environmental impact No pollution Very high pollution index
Percent of total U.S. Less than 1% Over 75%
energy
Reliability index Very high Good
performance losses. Table 6.2 depicts comparative losses between solar and fossil fuel
power generation systems. As evidenced by this example, when comparing solar
power generation with electric power generated by fossil fuel, the advantages of solar
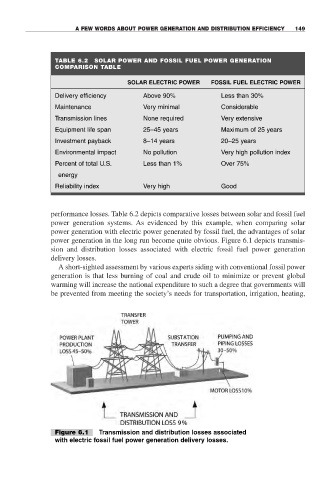
power generation in the long run become quite obvious. Figure 6.1 depicts transmis-
sion and distribution losses associated with electric fossil fuel power generation
delivery losses.
A short-sighted assessment by various experts siding with conventional fossil power
generation is that less burning of coal and crude oil to minimize or prevent global
warming will increase the national expenditure to such a degree that governments will
be prevented from meeting the society’s needs for transportation, irrigation, heating,
Figure 6.1 Transmission and distribution losses associated
with electric fossil fuel power generation delivery losses.