
Page 245 - Solar Power in Building Design The Engineer's Complete Design Resource
P. 245
INCENTIVE PAYMENT STRUCTURE 215
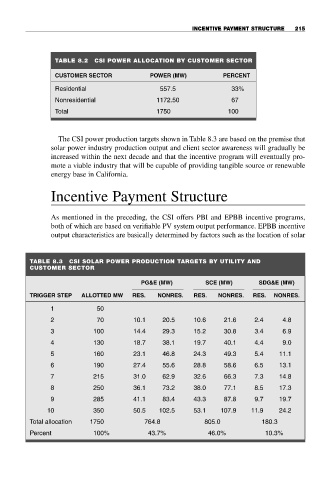
TABLE 8.2 CSI POWER ALLOCATION BY CUSTOMER SECTOR
CUSTOMER SECTOR POWER (MW) PERCENT
Residential 557.5 33%
Nonresidential 1172.50 67
Total 1750 100
The CSI power production targets shown in Table 8.3 are based on the premise that
solar power industry production output and client sector awareness will gradually be
increased within the next decade and that the incentive program will eventually pro-
mote a viable industry that will be capable of providing tangible source or renewable
energy base in California.
Incentive Payment Structure
As mentioned in the preceding, the CSI offers PBI and EPBB incentive programs,
both of which are based on verifiable PV system output performance. EPBB incentive
output characteristics are basically determined by factors such as the location of solar
TABLE 8.3 CSI SOLAR POWER PRODUCTION TARGETS BY UTILITY AND
CUSTOMER SECTOR
PG&E (MW) SCE (MW) SDG&E (MW)
TRIGGER STEP ALLOTTED MW RES. NONRES. RES. NONRES. RES. NONRES.
1 50
2 70 10.1 20.5 10.6 21.6 2.4 4.8
3 100 14.4 29.3 15.2 30.8 3.4 6.9
4 130 18.7 38.1 19.7 40.1 4.4 9.0
5 160 23.1 46.8 24.3 49.3 5.4 11.1
6 190 27.4 55.6 28.8 58.6 6.5 13.1
7 215 31.0 62.9 32.6 66.3 7.3 14.8
8 250 36.1 73.2 38.0 77.1 8.5 17.3
9 285 41.1 83.4 43.3 87.8 9.7 19.7
10 350 50.5 102.5 53.1 107.9 11.9 24.2
Total allocation 1750 764.8 805.0 180.3
Percent 100% 43.7% 46.0% 10.3%