
Page 240 - Solid Waste Analysis and Minimization a Systems Approach
P. 240
218 RESEARCH METHODOLOGY
Model Inputs
Gathered data from U.S. businesses and government agencies to be analyzed
Model Development
Characterize U.S. businesses and government agencies based on SIC codes
and solid waste compositions to determine waste groups
(multivariate cluster analysis)
Solid Waste Group 1 Solid Waste Solid Waste
• • • • •
Group 2 Group n
Quantify annual solid
waste generation
(multivariable regression
analysis)
Evaluate businesses and Performance Performance
government agencies by • • • • •
establishing performance Parameters Parameters
Group 2
Group n
parameters
Model Outputs
• Characterization and classification of U.S. businesses and government agencies
that generate similar solid waste compositions
• Determination of significant variables that influence solid waste quantities
• Prediction and evaluation of annual solid waste generation
• Evaluation of solid waste generation rates by establishing evaluation parameters
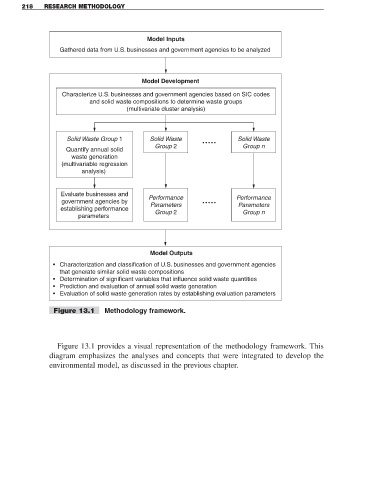
Figure 13.1 Methodology framework.
Figure 13.1 provides a visual representation of the methodology framework. This
diagram emphasizes the analyses and concepts that were integrated to develop the
environmental model, as discussed in the previous chapter.